Carriage Services Announces Fourth Quarter and Full Year 2022 Results

Conference call on Thursday, February 23, 2023 at 9:30 a.m. central time
OUTLOOK FOR 2023

HOUSTON, Feb. 22, 2023 (GLOBE NEWSWIRE) -- Carriage Services, Inc. (NYSE: CSV) today announced results for the fourth quarter and year ended December 31, 2022.
Company Highlights:
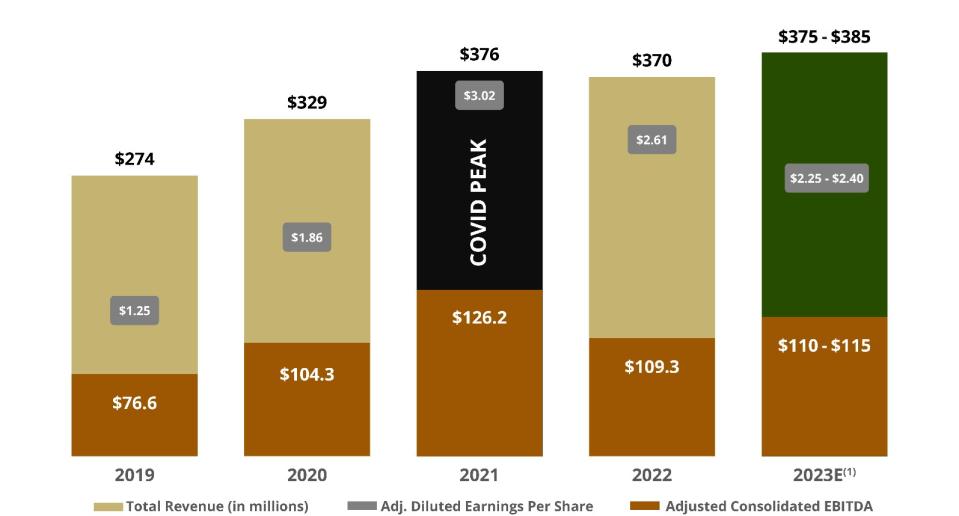
2022 full year performance compared to pre-COVID 2019 resulted in an impressive 10.5% compounded annual growth in total revenue and 27.8% compounded annual growth in adjusted diluted earnings per share;
Our fourth quarter 2022 results exceeded internal expectations, as trends in all segments improved over the prior quarter, in part driven by a higher number of non-COVID-19 related deaths;
We expect to close our transaction to acquire Greenlawn Funeral Homes and Cemeteries in Bakersfield, CA, within the next couple of weeks;
Consistent with our High Performance and Credit Profile Restoration Plan, which we announced on December 12, 2022, our capital allocation priority for 2023 will be to pay down debt and decrease our leverage to a range of 4.0-4.3 times by the end of 2024;
Strong financial revenue of more than $22 million for 2022 was highlighted by a positive return from our discretionary trust fund portfolio, as compared to broadly negative full year market comparables; and
Moving forward, we will provide full year guidance at the beginning of each year, beginning with our 2023 outlook.
Mel Payne, Chairman and CEO, stated, “We are excited to report our 2022 full year results, as performance exceeded our expectations, particularly against a unique 2021, during which COVID related deaths hit a peak. We ended 2022 with an impressive 27.8% compounded annual growth of our adjusted diluted earnings per share when compared to 2019, which was the last full year before the COVID impact. Net income is up nearly 25% as compared to 2021 and we continue to see positive trends within both our funeral and cemetery segments.
This strong performance positions us well as we enter 2023 and continue to focus our capital allocation efforts on paying down debt, while we integrate our recent acquisitions, and build upon the momentum within our sales organization.
We have also been soliciting feedback from our shareholders and have made some changes to how we report our performance, beginning with this release. While we continue to pride ourselves on being transparent, we believe this new format will help simplify the communication of our performance. Additionally, as we look to continuously improve the way we communicate expectations, we will begin providing annual guidance at the beginning of each year and update that guidance, if necessary, on a quarterly basis.
While we held off on providing guidance during the fourth quarter of 2022, to better assess the normalization of the death rate, we are now comfortable announcing our 2023 full year outlook. Our 2023 outlook is built in connection with supporting the capital allocation priorities outlined in our High Performance and Credit Profile Restoration Plan, which we announced on December 12th. For 2023, we are forecasting total revenue in the range of $375-$385 million, adjusted consolidated EBITDA in the range of $110-$115 million, and adjusted diluted earnings per share in the range of $2.25-$2.40.
Since 2018, we have been hard at work adding new talent, particularly within our Senior Leadership Team, implementing a new sales team, building best in class support, and providing our leaders in the field with the tools necessary to serve families at the highest level while also competing for every call. As we enter 2023, we are excited to watch these strategic investments continue to drive our performance forward while we identify new opportunities to support and accelerate our growth,” concluded Mr. Payne.
FINANCIAL HIGHLIGHTS
|
| Three Months Ended |
| Years Ended | ||||||||||
|
| December 31, |
| December 31, | ||||||||||
(000’s except margins) |
|
| 2021 |
|
| 2022 |
|
|
| 2021 |
|
| 2022 |
|
|
|
|
|
|
|
| ||||||||
GAAP Metrics: |
|
|
|
|
|
| ||||||||
Total revenue(1) |
| $ | 95,931 |
| $ | 93,916 |
|
| $ | 375,886 |
| $ | 370,174 |
|
Net income |
| $ | 13,347 |
| $ | 8,220 |
|
| $ | 33,159 |
| $ | 41,381 |
|
Net income margin |
|
| 13.9 | % |
| 8.8 | % |
|
| 8.8 | % |
| 11.2 | % |
Diluted EPS |
| $ | 0.77 |
| $ | 0.53 |
|
| $ | 1.81 |
| $ | 2.63 |
|
Cash provided by operating activities |
| $ | 14,547 |
| $ | 10,978 |
|
| $ | 84,246 |
| $ | 61,024 |
|
|
|
|
|
|
|
| ||||||||
Non-GAAP Metrics: |
|
|
|
|
|
| ||||||||
Adjusted consolidated EBITDA |
| $ | 30,395 |
| $ | 28,659 |
|
| $ | 126,161 |
| $ | 109,312 |
|
Adjusted consolidated EBITDA margin |
|
| 31.7 | % |
| 30.5 | % |
|
| 33.6 | % |
| 29.5 | % |
Adjusted diluted EPS |
| $ | 0.78 |
| $ | 0.64 |
|
| $ | 3.02 |
| $ | 2.61 |
|
Adjusted free cash flow |
| $ | 10,308 |
| $ | 8,904 |
|
| $ | 75,683 |
| $ | 49,792 |
|
(1) Total revenue is comprised of funeral operating revenue, cemetery operating revenue, divested revenue, ancillary revenue and financial revenue.
We present both GAAP and non-GAAP measures to provide investors with additional information. We believe that providing these non-GAAP measures along with GAAP measures allows for increased comparability of our ongoing performance from period to period. The most comparable GAAP measures to the Non-GAAP measures presented in this table can be found in the Reconciliation of Non-GAAP Financial Measures section of this press release.
Since our December announcement of entering a definitive agreement to acquire Greenlawn Funeral Homes and Cemeteries in Bakersfield, CA, we have been working closely with the Greenlawn Team and expect to close that transaction, pending regulatory approval, within the next couple of weeks. The addition of Greenlawn, which is the market leader in Bakersfield, with a nearly 40% market share, continues our strategy of partnering with premier businesses located in large, growing markets.
As of December 31, 2022, our bank covenant compliance leverage ratio was 5.35 times. While we expect near term fluctuations in our debt leverage ratio, we are committed to our previously announced target and expect to reach a bank covenant compliance leverage ratio of approximately 4.7 times by the end of 2023 and 4.0-4.3 times by the end of 2024.
OPERATIONS UPDATE
Funeral Operations
|
| Three Months Ended |
| Years Ended | ||||||||||
|
| December 31, |
| December 31, | ||||||||||
(000’s except contracts and margins) |
|
| 2021 |
|
| 2022 |
|
|
| 2021 |
|
| 2022 |
|
|
|
|
|
|
|
| ||||||||
Funeral contracts |
|
| 12,433 |
|
| 11,811 |
|
|
| 48,605 |
|
| 47,184 |
|
Funeral operating revenue |
| $ | 65,366 |
| $ | 63,964 |
|
| $ | 252,926 |
| $ | 251,396 |
|
Funeral operating EBITDA(1) |
| $ | 28,017 |
| $ | 26,874 |
|
| $ | 109,204 |
| $ | 101,951 |
|
Funeral operating EBITDA margin(1) |
|
| 42.9 | % |
| 42.0 | % |
|
| 43.2 | % |
| 40.6 | % |
(1)The most comparable GAAP measures to the Non-GAAP measures presented in this table can be found in the Reconciliation of Non-GAAP Financial Measures section of this press release.
Our funeral home segment exceeded our expectations in the fourth quarter of 2022, demonstrating the resilience of our decentralized business model even in challenging times. Despite experiencing a modest 2.1% decline in funeral operating revenue compared to the peak COVID-19 death impact in 2021, we are proud to report an impressive compounded annual growth rate (“CAGR”) of 8.6% versus our pre-COVID baseline in 2019. Although funeral contracts were down by 5.0% compared to the same quarter in 2021, we are pleased to note that our fourth quarter 2022 average revenue per contract increased by 2.9% over the same period in 2021. Funeral operating EBITDA also performed well, with a decrease of 4.1%, or $1.1 million, and funeral operating EBITDA margin was down 90 basis points to 42.0%. This is primarily due to our proactive efforts to mitigate inflationary costs within our control.
For the full year of 2022, we served 47,184 funeral contracts, representing a slight decrease of 2.9%. Despite this, our funeral operating revenue was $251.4 million, a decrease of 0.6%, and funeral operating EBITDA was $101.9 million, a decrease of 6.6%. Based on our fourth quarter performance, we are confident that we can continue driving organic growth and integrating our latest acquisitions while taking proactive measures to mitigate inflationary cost pressures. We are committed to delivering high-quality funeral services to our client families while providing exceptional value to our shareholders.
Cemetery Operations
|
| Three Months Ended |
| Years Ended | ||||||||||
|
| December 31, |
| December 31, | ||||||||||
(000’s except margins) |
|
| 2021 |
|
| 2022 |
|
|
| 2021 |
|
| 2022 |
|
|
|
|
|
|
|
| ||||||||
Cemetery preneed sales |
| $ | 15,958 |
| $ | 15,696 |
|
| $ | 65,116 |
| $ | 62,178 |
|
Cemetery operating revenue |
| $ | 22,461 |
| $ | 23,169 |
|
| $ | 91,330 |
| $ | 90,033 |
|
Cemetery operating EBITDA(1) |
| $ | 10,019 |
| $ | 9,910 |
|
| $ | 42,158 |
| $ | 37,509 |
|
Cemetery operating EBITDA margin(1) |
|
| 44.6 | % |
| 42.8 | % |
|
| 46.2 | % |
| 41.7 | % |
(1)The most comparable GAAP measures to the Non-GAAP measures presented in this table can be found in the Reconciliation of Non-GAAP Financial Measures section of this press release.
For the fourth quarter of 2022, our cemetery operating revenue grew by 3.2% compared to last year. Even through a challenging economic environment, our cemetery operating EBITDA experienced a slight decline of 1.1% due to the proactive measures taken by our field leaders to manage the impact of inflationary costs, leading to a cemetery operating EBITDA margin decrease of 180 basis points to 42.8% compared to the same quarter of the previous year, we remain confident in our ability to navigate these headwinds. We recorded a $0.4 million increase in recognized cemetery property revenue when compared to the same period in 2021, despite preneed property sales decreasing by $0.5 million or 3.8%.
For the full year, cemetery operating revenue ended at $90 million, down by 1.4% compared to 2021, and cemetery operating EBITDA was $37.5 million, down by 11%. The decline in cemetery operating EBITDA was driven primarily by inflationary operating costs that started at the beginning of the second quarter of 2022. However, we are encouraged by our fourth quarter performance, which indicates that the measures we have taken should continue to produce positive results.
Looking ahead, we anticipate that our preneed sales organization will continue to mature, and we expect preneed sales to grow by low double digits above 2022 levels. It is worth noting that since 2019, when we positioned ourselves to build and support our High Performance Sales Organization, our cemetery operating revenue has experienced a CAGR of 22.2%. We are optimistic about the future of our cemetery portfolio and are confident that we will continue to grow and thrive in the years to come.
TRUST FUND PERFORMANCE
|
| YTD 2022 |
| Annualized |
CSV Discretionary portfolio |
| 0.6% |
| 13.3% |
S&P 500 |
| (18.1)% |
| 13.1% |
DJIA |
| (6.9)% |
| 12.7% |
NASDAQ |
| (32.5)% |
| 15.8% |
HY Bond index |
| (11.2)% |
| 8.9% |
Our discretionary trust fund portfolio returned 10.0% in the fourth quarter of 2022, versus 7.5% for the S&P 500 and 4.2% for the High Yield Bond index. On a full year basis, the portfolio had a positive return of 0.6%, while all four indices posted negative returns. The allocation of our portfolio was roughly 46% fixed income, 43% equities, and 11% cash as of December 31, 2022.
Since 2020, our portfolio has generated approximately $46.5 million in net capital gains, including $13.0 million of gains recorded in 2022. Our total recurring annual income is up nearly 19% to $20.8 million at the end of 2022 from $17.5 million in the previous year, and represents an 8.4% yield on the portfolio’s total market value of $246.3 million as of December 31, 2022.
While the markets ended 2022 on a negative note as concerns about inflation, higher interest rates, and future economic growth drove volatility throughout the year, the performance of our portfolio outperformed as we maintained focus on various income-driven investments as well as some non-income investments in the energy sector.
OUTLOOK FOR 2023
(in millions - except per share amounts) | 2023 Outlook |
Total revenue | $375 - $385 |
Adjusted consolidated EBITDA | $110 - $115 |
Adjusted diluted earnings per share | $2.25 - $2.40 |
Adjusted free cash flow | $50 - $60 |
A photo accompanying this announcement is available at https://www.globenewswire.com/NewsRoom/AttachmentNg/81f0c2c3-8f07-4c48-934f-7d6c4aef7d7a
(1 | ) | Includes ten months of proforma EBITDA from the Greenlawn acquisition expected to close in late February/early March 2023. Lower earnings per share is primarily due to higher interest expense when compared to 2022 and increased overhead costs related to our digital transformation investments. |
|
|
|
CALL AND INVESTOR RELATIONS CONTACT
Carriage Services has scheduled a conference call for tomorrow, February 23, 2023 at 9:30 a.m. central time. To participate live over the phone via audio conferencing click link or live over the Internet via webcast click link. An audio archive of the call will be available on demand via the Company’s website at www.carriageservices.com. For any investor relations questions, please email InvestorRelations@carriageservices.com.
CARRIAGE SERVICES, INC. | ||||||||||||||||||||
CONDENSED OPERATING AND FINANCIAL TREND REPORT | ||||||||||||||||||||
(in thousands - except per share amounts) | ||||||||||||||||||||
| ||||||||||||||||||||
|
|
| 2018 |
|
|
| 2019 |
|
|
| 2020 |
|
|
| 2021 |
|
|
| 2022 |
|
Funeral operating revenue |
| $ | 190,098 |
|
| $ | 196,475 |
|
| $ | 226,819 |
|
| $ | 252,926 |
|
| $ | 251,396 |
|
Cemetery operating revenue |
|
| 44,588 |
|
|
| 49,317 |
|
|
| 69,083 |
|
|
| 91,330 |
|
|
| 90,033 |
|
Financial revenue |
|
| 15,688 |
|
|
| 15,878 |
|
|
| 19,689 |
|
|
| 22,708 |
|
|
| 22,452 |
|
Ancillary revenue |
|
| — |
|
|
| 748 |
|
|
| 4,661 |
|
|
| 4,437 |
|
|
| 4,193 |
|
Divested/planned divested revenue |
|
| 17,618 |
|
|
| 11,689 |
|
|
| 9,196 |
|
|
| 4,485 |
|
|
| 2,100 |
|
Total revenue |
| $ | 267,992 |
|
| $ | 274,107 |
|
| $ | 329,448 |
|
| $ | 375,886 |
|
| $ | 370,174 |
|
|
|
|
|
|
|
|
|
|
|
| ||||||||||
Funeral operating EBITDA |
| $ | 71,727 |
|
| $ | 75,553 |
|
| $ | 93,480 |
|
| $ | 109,204 |
|
| $ | 101,951 |
|
Funeral operating EBITDA margin |
|
| 37.7 | % |
|
| 38.5 | % |
|
| 41.2 | % |
|
| 43.2 | % |
|
| 40.6 | % |
|
|
|
|
|
|
|
|
|
|
| ||||||||||
Cemetery operating EBITDA |
|
| 13,844 |
|
|
| 17,164 |
|
|
| 26,627 |
|
|
| 42,158 |
|
|
| 37,509 |
|
Cemetery operating EBITDA margin |
|
| 31.0 | % |
|
| 34.8 | % |
|
| 38.5 | % |
|
| 46.2 | % |
|
| 41.7 | % |
|
|
|
|
|
|
|
|
|
|
| ||||||||||
Financial EBITDA |
|
| 14,139 |
|
|
| 14,272 |
|
|
| 18,357 |
|
|
| 21,156 |
|
|
| 20,767 |
|
Financial EBITDA margin |
|
| 90.1 | % |
|
| 89.9 | % |
|
| 93.2 | % |
|
| 93.2 | % |
|
| 92.5 | % |
|
|
|
|
|
|
|
|
|
|
| ||||||||||
Ancillary EBITDA |
|
| — |
|
|
| 298 |
|
|
| 1,186 |
|
|
| 1,006 |
|
|
| 841 |
|
Ancillary EBITDA margin |
|
| — | % |
|
| 39.8 | % |
|
| 25.4 | % |
|
| 22.7 | % |
|
| 20.1 | % |
|
|
|
|
|
|
|
|
|
|
| ||||||||||
Divested/planned divested EBITDA |
|
| 4,603 |
|
|
| 2,480 |
|
|
| 2,292 |
|
|
| 1,117 |
|
|
| 293 |
|
Divested/planned divested EBITDA margin |
|
| 26.1 | % |
|
| 21.2 | % |
|
| 24.9 | % |
|
| 24.9 | % |
|
| 14.0 | % |
Total EBITDA |
| $ | 104,313 |
|
| $ | 109,767 |
|
| $ | 141,942 |
|
| $ | 174,641 |
|
| $ | 161,361 |
|
Total EBITDA margin |
|
| 38.9 | % |
|
| 40.0 | % |
|
| 43.1 | % |
|
| 46.5 | % |
|
| 43.6 | % |
|
|
|
|
|
|
|
|
|
|
| ||||||||||
Total overhead |
| $ | 36,993 |
|
| $ | 37,554 |
|
| $ | 40,514 |
|
| $ | 54,282 |
|
| $ | 53,848 |
|
Overhead as a percentage of revenue |
|
| 13.8 | % |
|
| 13.7 | % |
|
| 12.3 | % |
|
| 14.4 | % |
|
| 14.5 | % |
|
|
|
|
|
|
|
|
|
|
| ||||||||||
Consolidated EBITDA |
| $ | 67,320 |
|
| $ | 72,213 |
|
| $ | 101,428 |
|
| $ | 120,359 |
|
| $ | 107,513 |
|
Consolidated EBITDA margin |
|
| 25.1 | % |
|
| 26.3 | % |
|
| 30.8 | % |
|
| 32.0 | % |
|
| 29.0 | % |
|
|
|
|
|
|
|
|
|
|
| ||||||||||
Other expenses and interest |
|
|
|
|
|
|
|
|
|
| ||||||||||
Depreciation & amortization |
| $ | 17,430 |
|
| $ | 17,771 |
|
| $ | 19,389 |
|
| $ | 20,520 |
|
| $ | 19,799 |
|
Non-cash stock compensation |
|
| 6,583 |
|
|
| 2,153 |
|
|
| 3,370 |
|
|
| 5,513 |
|
|
| 5,959 |
|
Interest expense |
|
| 21,109 |
|
|
| 25,522 |
|
|
| 32,515 |
|
|
| 25,445 |
|
|
| 25,895 |
|
Loss on extinguishment of debt |
|
| 502 |
|
|
| — |
|
|
| 6 |
|
|
| 23,807 |
|
|
| 190 |
|
Other |
|
| 3,430 |
|
|
| 4,351 |
|
|
| 21,506 |
|
|
| 770 |
|
|
| (1,524 | ) |
Pretax income |
| $ | 18,266 |
|
| $ | 22,416 |
|
| $ | 24,642 |
|
| $ | 44,304 |
|
| $ | 57,194 |
|
Net tax expense |
|
| 6,621 |
|
|
| 7,883 |
|
|
| 8,552 |
|
|
| 11,145 |
|
|
| 15,813 |
|
Net income |
| $ | 11,645 |
|
| $ | 14,533 |
|
| $ | 16,090 |
|
| $ | 33,159 |
|
| $ | 41,381 |
|
Special items(1) |
| $ | 11,650 |
|
| $ | 9,821 |
|
| $ | 25,579 |
|
| $ | 30,607 |
|
| $ | (200 | ) |
Tax effect on special items |
|
| 1,729 |
|
|
| 1,822 |
|
|
| 7,986 |
|
|
| 8,503 |
|
|
| 95 |
|
Adjusted net income |
| $ | 21,566 |
|
| $ | 22,532 |
|
| $ | 33,683 |
|
| $ | 55,263 |
|
| $ | 41,086 |
|
Adjusted net income margin |
|
| 8.0 | % |
|
| 8.2 | % |
|
| 10.2 | % |
|
| 14.7 | % |
|
| 11.1 | % |
|
|
|
|
|
|
|
|
|
|
| ||||||||||
Adjusted basic earnings per share |
| $ | 1.19 |
|
| $ | 1.26 |
|
| $ | 1.88 |
|
| $ | 3.17 |
|
| $ | 2.76 |
|
Adjusted diluted earnings per share |
| $ | 1.17 |
|
| $ | 1.25 |
|
| $ | 1.86 |
|
| $ | 3.02 |
|
| $ | 2.61 |
|
|
|
|
|
|
|
|
|
|
|
| ||||||||||
GAAP basic earnings per share |
| $ | 0.64 |
|
| $ | 0.81 |
|
| $ | 0.90 |
|
| $ | 1.90 |
|
| $ | 2.78 |
|
GAAP diluted earnings per share |
| $ | 0.63 |
|
| $ | 0.80 |
|
| $ | 0.89 |
|
| $ | 1.81 |
|
| $ | 2.63 |
|
|
|
|
|
|
|
|
|
|
|
| ||||||||||
Weighted average shares o/s - basic |
|
| 17,971 |
|
|
| 17,877 |
|
|
| 17,872 |
|
|
| 17,409 |
|
|
| 14,857 |
|
Weighted average shares o/s - diluted |
|
| 18,374 |
|
|
| 18,005 |
|
|
| 18,077 |
|
|
| 18,266 |
|
|
| 15,710 |
|
|
|
|
|
|
|
|
|
|
|
| ||||||||||
Reconciliation of Consolidated EBITDA to Adjusted consolidated EBITDA |
|
|
|
|
|
|
|
|
|
| ||||||||||
Consolidated EBITDA |
| $ | 67,320 |
|
| $ | 72,213 |
|
| $ | 101,428 |
|
| $ | 120,359 |
|
| $ | 107,513 |
|
Special items(1) |
|
| 2,872 |
|
|
| 4,374 |
|
|
| 2,822 |
|
|
| 5,802 |
|
|
| 1,799 |
|
Adjusted consolidated EBITDA |
| $ | 70,192 |
|
| $ | 76,587 |
|
| $ | 104,250 |
|
| $ | 126,161 |
|
| $ | 109,312 |
|
Adjusted consolidated EBITDA margin |
|
| 26.2 | % |
|
| 27.9 | % |
|
| 31.6 | % |
|
| 33.6 | % |
|
| 29.5 | % |
(1) A detail of our Special items presented in this table can be found in the Reconciliation of Non-GAAP Financial Measures section of this press release.
CARRIAGE SERVICES, INC. | |||||||
CONDENSED CONSOLIDATED BALANCE SHEET | |||||||
(in thousands) | |||||||
| December 31, | ||||||
|
| 2021 |
|
|
| 2022 |
|
ASSETS |
|
|
| ||||
Current assets: |
|
|
| ||||
Cash and cash equivalents | $ | 1,148 |
|
| $ | 1,170 |
|
Accounts receivable, net |
| 25,314 |
|
|
| 24,458 |
|
Inventories |
| 7,346 |
|
|
| 7,613 |
|
Prepaid and other current assets |
| 6,404 |
|
|
| 4,733 |
|
Total current assets |
| 40,212 |
|
|
| 37,974 |
|
Preneed cemetery trust investments |
| 100,903 |
|
|
| 95,065 |
|
Preneed funeral trust investments |
| 113,658 |
|
|
| 104,553 |
|
Preneed cemetery receivables, net |
| 23,150 |
|
|
| 26,672 |
|
Receivables from funeral preneed trusts, net |
| 19,009 |
|
|
| 19,976 |
|
Property, plant and equipment, net |
| 269,367 |
|
|
| 278,106 |
|
Cemetery property, net |
| 100,701 |
|
|
| 104,170 |
|
Goodwill |
| 391,972 |
|
|
| 410,137 |
|
Intangible and other non-current assets, net |
| 29,378 |
|
|
| 32,930 |
|
Operating lease right-of-use assets |
| 17,881 |
|
|
| 17,060 |
|
Cemetery perpetual care trust investments |
| 72,400 |
|
|
| 66,307 |
|
Total assets | $ | 1,178,631 |
|
| $ | 1,192,950 |
|
LIABILITIES AND STOCKHOLDERS’ EQUITY |
|
|
| ||||
Current liabilities: |
|
|
| ||||
Current portion of debt and lease obligations | $ | 2,809 |
|
| $ | 3,172 |
|
Accounts payable |
| 14,205 |
|
|
| 11,675 |
|
Accrued and other liabilities |
| 43,773 |
|
|
| 30,621 |
|
Total current liabilities |
| 60,787 |
|
|
| 45,468 |
|
Acquisition debt, net of current portion |
| 3,979 |
|
|
| 3,438 |
|
Credit facility |
| 153,857 |
|
|
| 188,836 |
|
Senior notes |
| 394,610 |
|
|
| 395,243 |
|
Obligations under finance leases, net of current portion |
| 5,157 |
|
|
| 4,743 |
|
Obligations under operating leases, net of current portion |
| 18,520 |
|
|
| 17,315 |
|
Deferred preneed cemetery revenue |
| 50,202 |
|
|
| 51,746 |
|
Deferred preneed funeral revenue |
| 30,584 |
|
|
| 32,029 |
|
Deferred tax liability |
| 45,784 |
|
|
| 48,820 |
|
Other long-term liabilities |
| 1,419 |
|
|
| 3,065 |
|
Deferred preneed cemetery receipts held in trust |
| 100,903 |
|
|
| 95,065 |
|
Deferred preneed funeral receipts held in trust |
| 113,658 |
|
|
| 104,553 |
|
Care trusts’ corpus |
| 71,156 |
|
|
| 65,495 |
|
Total liabilities |
| 1,050,616 |
|
|
| 1,055,816 |
|
Commitments and contingencies: |
|
|
| ||||
Stockholders’ equity: |
|
|
| ||||
Common stock |
| 263 |
|
|
| 264 |
|
Additional paid-in capital |
| 236,809 |
|
|
| 238,780 |
|
Retained earnings |
| 135,462 |
|
|
| 176,843 |
|
Treasury stock |
| (244,519 | ) |
|
| (278,753 | ) |
Total stockholders’ equity |
| 128,015 |
|
|
| 137,134 |
|
Total liabilities and stockholders’ equity | $ | 1,178,631 |
|
| $ | 1,192,950 |
|
|
|
|
|
|
|
|
|
| |||||||||||||||
CARRIAGE SERVICES, INC. | |||||||||||||||
CONSOLIDATED STATEMENTS OF OPERATIONS | |||||||||||||||
(in thousands, except per share data) | |||||||||||||||
| (unaudited) |
|
|
|
| ||||||||||
| Three Months Ended |
| Years Ended | ||||||||||||
| December 31, |
| December 31, | ||||||||||||
|
| 2021 |
|
|
| 2022 |
|
|
| 2021 |
|
|
| 2022 |
|
|
|
|
|
|
|
|
| ||||||||
Revenue: |
|
|
|
|
|
|
| ||||||||
Service revenue | $ | 46,486 |
|
| $ | 45,992 |
|
| $ | 180,572 |
|
| $ | 181,271 |
|
Property and merchandise revenue |
| 42,176 |
|
|
| 41,475 |
|
|
| 167,721 |
|
|
| 161,970 |
|
Other revenue |
| 7,269 |
|
|
| 6,449 |
|
|
| 27,593 |
|
|
| 26,933 |
|
|
| 95,931 |
|
|
| 93,916 |
|
|
| 375,886 |
|
|
| 370,174 |
|
Field costs and expenses: |
|
|
|
|
|
|
| ||||||||
Cost of service |
| 21,322 |
|
|
| 21,517 |
|
|
| 82,395 |
|
|
| 87,322 |
|
Cost of merchandise |
| 29,199 |
|
|
| 29,149 |
|
|
| 113,871 |
|
|
| 116,453 |
|
Cemetery property amortization |
| 1,457 |
|
|
| 1,545 |
|
|
| 6,670 |
|
|
| 5,859 |
|
Field depreciation expense |
| 3,177 |
|
|
| 3,485 |
|
|
| 12,609 |
|
|
| 13,316 |
|
Regional and unallocated funeral and cemetery costs |
| 7,191 |
|
|
| 5,551 |
|
|
| 25,846 |
|
|
| 22,960 |
|
Other expenses |
| 1,221 |
|
|
| 1,231 |
|
|
| 4,979 |
|
|
| 5,038 |
|
|
| 63,567 |
|
|
| 62,478 |
|
|
| 246,370 |
|
|
| 250,948 |
|
Gross profit |
| 32,364 |
|
|
| 31,438 |
|
|
| 129,516 |
|
|
| 119,226 |
|
|
|
|
|
|
|
|
| ||||||||
Corporate costs and expenses: |
|
|
|
|
|
|
| ||||||||
General, administrative and other |
| 9,850 |
|
|
| 9,348 |
|
|
| 35,190 |
|
|
| 37,471 |
|
Net (gain) loss on divestitures, disposals and impairment charges |
| (711 | ) |
|
| 2,462 |
|
|
| 666 |
|
|
| 2,029 |
|
Operating income |
| 23,225 |
|
|
| 19,628 |
|
|
| 93,660 |
|
|
| 79,726 |
|
|
|
|
|
|
|
|
| ||||||||
Interest expense |
| (5,307 | ) |
|
| (7,687 | ) |
|
| (25,445 | ) |
|
| (25,895 | ) |
Loss on extinguishment of debt |
| — |
|
|
| (190 | ) |
|
| (23,807 | ) |
|
| (190 | ) |
Gain on insurance reimbursements |
| — |
|
|
| 196 |
|
|
| — |
|
|
| 3,471 |
|
Other, net |
| 3 |
|
|
| 4 |
|
|
| (104 | ) |
|
| 82 |
|
Income before income taxes |
| 17,921 |
|
|
| 11,951 |
|
|
| 44,304 |
|
|
| 57,194 |
|
Expense for income taxes |
| (4,850 | ) |
|
| (3,665 | ) |
|
| (12,316 | ) |
|
| (16,243 | ) |
Tax adjustment related to discrete items |
| 276 |
|
|
| (66 | ) |
|
| 1,171 |
|
|
| 430 |
|
Total expense for income taxes |
| (4,574 | ) |
|
| (3,731 | ) |
|
| (11,145 | ) |
|
| (15,813 | ) |
Net income | $ | 13,347 |
|
| $ | 8,220 |
|
| $ | 33,159 |
|
| $ | 41,381 |
|
|
|
|
|
|
|
|
| ||||||||
Basic earnings per common share: | $ | 0.82 |
|
| $ | 0.56 |
|
| $ | 1.90 |
|
| $ | 2.78 |
|
Diluted earnings per common share: | $ | 0.77 |
|
| $ | 0.53 |
|
| $ | 1.81 |
|
| $ | 2.63 |
|
|
|
|
|
|
|
|
| ||||||||
Dividends declared per common share: | $ | 0.1125 |
|
| $ | 0.1125 |
|
| $ | 0.4125 |
|
| $ | 0.4500 |
|
Weighted average number of common and common equivalent shares outstanding: |
|
|
|
|
|
|
| ||||||||
Basic |
| 16,233 |
|
|
| 14,707 |
|
|
| 17,409 |
|
|
| 14,857 |
|
Diluted |
| 17,400 |
|
|
| 15,418 |
|
|
| 18,266 |
|
|
| 15,710 |
|
|
|
|
|
|
|
|
|
|
|
|
|
| |||
