Carr's Group plc's (LON:CARR) Stock Has Been Sliding But Fundamentals Look Strong: Is The Market Wrong?

Want to participate in a short research study? Help shape the future of investing tools and earn a $40 gift card!
With its stock down 4.5% over the past week, it is easy to disregard Carr's Group (LON:CARR). However, a closer look at its sound financials might cause you to think again. Given that fundamentals usually drive long-term market outcomes, the company is worth looking at. Particularly, we will be paying attention to Carr's Group's ROE today.
ROE or return on equity is a useful tool to assess how effectively a company can generate returns on the investment it received from its shareholders. Simply put, it is used to assess the profitability of a company in relation to its equity capital.
Check out our latest analysis for Carr's Group
How Is ROE Calculated?
ROE can be calculated by using the formula:
Return on Equity = Net Profit (from continuing operations) ÷ Shareholders' Equity
So, based on the above formula, the ROE for Carr's Group is:
11% = UK£14m ÷ UK£131m (Based on the trailing twelve months to February 2020).
The 'return' is the amount earned after tax over the last twelve months. That means that for every £1 worth of shareholders' equity, the company generated £0.11 in profit.
What Has ROE Got To Do With Earnings Growth?
So far, we've learned that ROE is a measure of a company's profitability. Depending on how much of these profits the company reinvests or "retains", and how effectively it does so, we are then able to assess a company’s earnings growth potential. Assuming all else is equal, companies that have both a higher return on equity and higher profit retention are usually the ones that have a higher growth rate when compared to companies that don't have the same features.
Carr's Group's Earnings Growth And 11% ROE
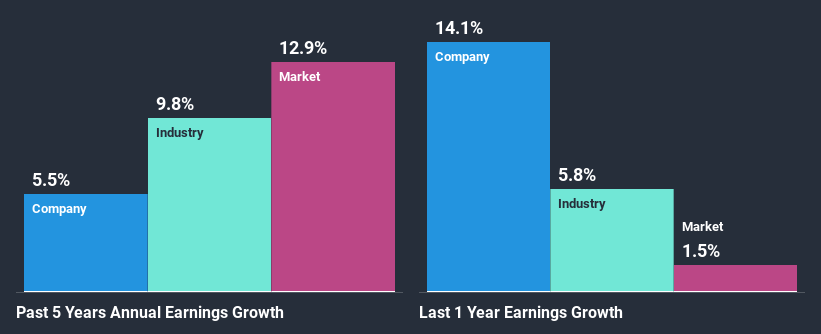
At first glance, Carr's Group seems to have a decent ROE. Further, the company's ROE is similar to the industry average of 10%. This probably goes some way in explaining Carr's Group's moderate 5.5% growth over the past five years amongst other factors.
As a next step, we compared Carr's Group's net income growth with the industry and were disappointed to see that the company's growth is lower than the industry average growth of 9.8% in the same period.
The basis for attaching value to a company is, to a great extent, tied to its earnings growth. The investor should try to establish if the expected growth or decline in earnings, whichever the case may be, is priced in. This then helps them determine if the stock is placed for a bright or bleak future. One good indicator of expected earnings growth is the P/E ratio which determines the price the market is willing to pay for a stock based on its earnings prospects. So, you may want to check if Carr's Group is trading on a high P/E or a low P/E, relative to its industry.
Is Carr's Group Using Its Retained Earnings Effectively?
Carr's Group has a three-year median payout ratio of 36%, which implies that it retains the remaining 64% of its profits. This suggests that its dividend is well covered, and given the decent growth seen by the company, it looks like management is reinvesting its earnings efficiently.
Moreover, Carr's Group is determined to keep sharing its profits with shareholders which we infer from its long history of paying a dividend for at least ten years. Our latest analyst data shows that the future payout ratio of the company over the next three years is expected to be approximately 35%. Therefore, the company's future ROE is also not expected to change by much with analysts predicting an ROE of 10%.
Summary
In total, we are pretty happy with Carr's Group's performance. In particular, it's great to see that the company is investing heavily into its business and along with a high rate of return, that has resulted in a respectable growth in its earnings. On studying current analyst estimates, we found that analysts expect the company to continue its recent growth streak. To know more about the company's future earnings growth forecasts take a look at this free report on analyst forecasts for the company to find out more.
This article by Simply Wall St is general in nature. It does not constitute a recommendation to buy or sell any stock, and does not take account of your objectives, or your financial situation. We aim to bring you long-term focused analysis driven by fundamental data. Note that our analysis may not factor in the latest price-sensitive company announcements or qualitative material. Simply Wall St has no position in any stocks mentioned.
Have feedback on this article? Concerned about the content? Get in touch with us directly. Alternatively, email editorial-team@simplywallst.com.
