Carter's (NYSE:CRI) Reports Sales Below Analyst Estimates In Q4 Earnings

Children’s apparel manufacturer Carter’s (NYSE:CRI) missed analysts' expectations in Q4 FY2023, with revenue down 5.9% year on year to $857.9 million. Next quarter's revenue guidance of $632.5 million also underwhelmed, coming in 8.9% below analysts' estimates. It made a non-GAAP profit of $2.76 per share, improving from its profit of $2.29 per share in the same quarter last year.
Is now the time to buy Carter's? Find out by accessing our full research report, it's free.
Carter's (CRI) Q4 FY2023 Highlights:
Revenue: $857.9 million vs analyst estimates of $869.1 million (1.3% miss)
EPS (non-GAAP): $2.76 vs analyst estimates of $2.61 (5.8% beat)
Revenue Guidance for Q1 2024 is $632.5 million at the midpoint, below analyst estimates of $694.3 million
EPS (non-GAAP) Guidance for Q1 2024 is $0.65 at the midpoint, below analyst estimates of $1.05
Management's revenue guidance for the upcoming financial year 2024 is $3 billion at the midpoint, in line with analyst expectations and implying 1.8% growth (vs -8.6% in FY2023)
Gross Margin (GAAP): 48.7%, up from 45.6% in the same quarter last year
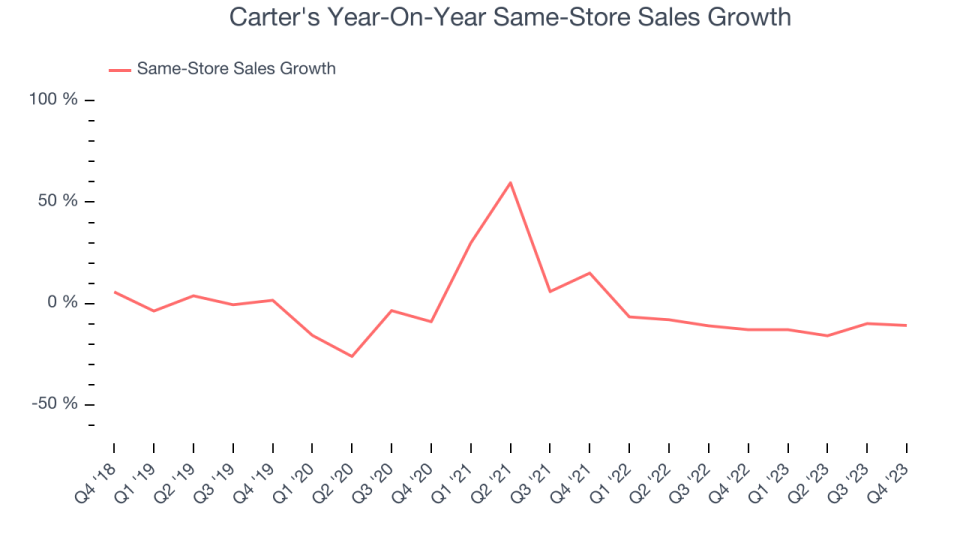
Same-Store Sales were down 10.8% year on year
Market Capitalization: $3 billion
“We saw an improving trend in the demand for our brands in the final weeks of 2023,” said Michael D. Casey, Chairman and Chief Executive Officer.
Rumored to sell more than 10 products for every child born in the United States, Carter's (NYSE:CRI) is an American designer and marketer of children's apparel.
Apparel, Accessories and Luxury Goods
Within apparel and accessories, not only do styles change more frequently today than decades past as fads travel through social media and the internet but consumers are also shifting the way they buy their goods, favoring omnichannel and e-commerce experiences. Some apparel, accessories, and luxury goods companies have made concerted efforts to adapt while those who are slower to move may fall behind.
Sales Growth
A company’s long-term performance can give signals about its business quality. Any business can put up a good quarter or two, but many enduring ones muster years of growth. Carter's revenue declined over the last five years, dropping 3.2% annually.
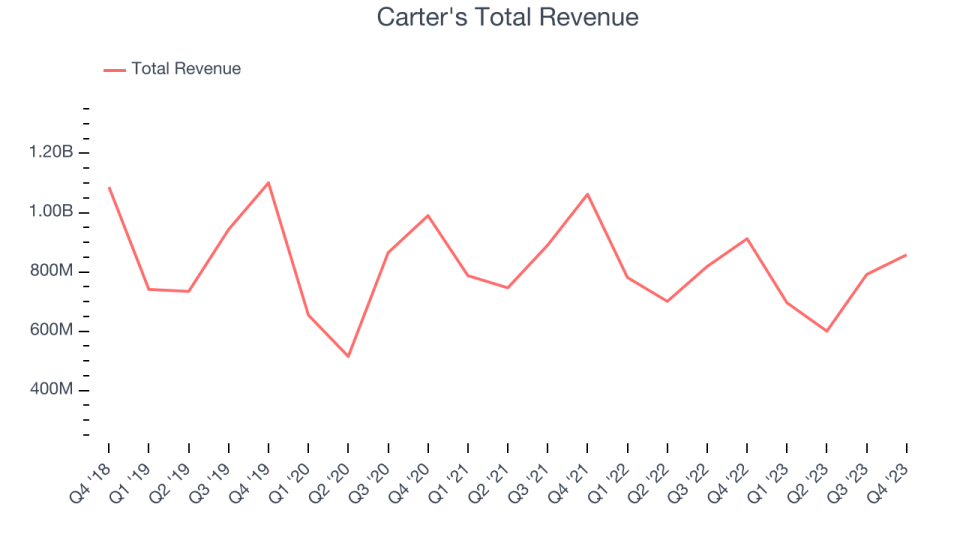
Within consumer discretionary, product cycles are short and revenue can be hit-driven due to rapidly changing trends. That's why we also follow short-term performance. Carter's recent history shows its demand has decreased even further as its revenue has shown annualized declines of 8.1% over the last two years.
We can better understand the company's revenue dynamics by analyzing its same-store sales, which show how much revenue its established locations generate. Over the last two years, Carter's same-store sales averaged 11% year-on-year declines. Because this number is lower than its revenue growth, we can see the opening of new locations is somewhat improving the company's top-line performance.
This quarter, Carter's missed Wall Street's estimates and reported a rather uninspiring 5.9% year-on-year revenue decline, generating $857.9 million of revenue. The company is guiding for a 9.1% year-on-year revenue decline next quarter to $632.5 million, an improvement from the 10.9% year-on-year decrease it recorded in the same quarter last year. Looking ahead, Wall Street expects sales to grow 1.9% over the next 12 months, an acceleration from this quarter.
Unless you’ve been living under a rock, it should be obvious by now that generative AI is going to have a huge impact on how large corporations do business. While Nvidia and AMD are trading close to all-time highs, we prefer a lesser-known (but still profitable) semiconductor stock benefitting from the rise of AI. Click here to access our free report on our favorite semiconductor growth story.
Operating Margin
Operating margin is a key measure of profitability. Think of it as net income–the bottom line–excluding the impact of taxes and interest on debt, which are less connected to business fundamentals.
Carter's has done a decent job managing its expenses over the last eight quarters. The company has produced an average operating margin of 11.4%, higher than the broader consumer discretionary sector.
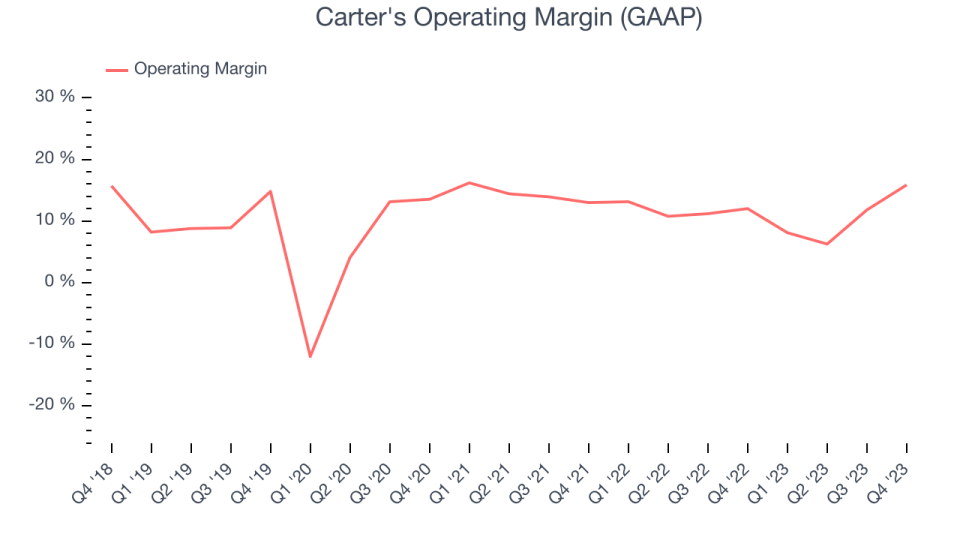
In Q4, Carter's generated an operating profit margin of 15.9%, up 3.9 percentage points year on year.
Over the next 12 months, Wall Street expects Carter's to maintain its LTM operating margin of 11%.
Key Takeaways from Carter's Q4 Results
It was encouraging to see Carter's slightly top analysts' EPS expectations this quarter. We were also happy its operating margin narrowly outperformed Wall Street's estimates. On the other hand, its earnings forecast for next quarter missed and its revenue guidance also fell short of Wall Street's estimates. Overall, the results could have been better. The stock is up 1.8% in the pre-market and currently trades at $83 per share.
So should you invest in Carter's right now? When making that decision, it's important to consider its valuation, business qualities, as well as what has happened in the latest quarter. We cover that in our actionable full research report which you can read here, it's free.
