
Caution: If You're Planning to Buy Stocks at All-Time Highs, Read This First
Financial plans usually look best in theory. They are developed based on the numbers and almost always ignore the emotional challenges that will be required to follow a plan. In reality, it can be difficult to add to stock market holdings when major market indexes are setting new all-time highs. It is also difficult for many investors to buy stocks when market averages are falling.
We believe that long-term plans work well, but risk needs to be minimized in both bull and bear markets. With a simple strategy, the risks of a typical, well-balanced portfolio could be reduced and allow investors to beat the market in the long run.
Many financial plans use simple asset allocation rules with a 60% stock/40% bond portfolio being popular. Rebalancing is done perhaps annually, and new money is usually added monthly or annually. By using options when they add money to a long-term investment account, investors could see substantial benefits.
Right now, stock markets are at all-time highs as many investors are making annual contributions to retirement accounts. Those who have a plan calling for an investment now should consider selling calls against the positions they add, which will effectively reduce the price they pay for their buys.
Covered call writing is generally considered to be a conservative strategy. When you write a call option against a stock or ETF you own, the position is covered so the risk is limited. If prices fall, you would have suffered a loss anyway, but the income from selling the option reduces the loss. If prices rise, you earn a guaranteed profit and receive cash that will let you open a new position.
Covered calls are allowed in many retirement accounts, but you should check with your broker before deciding to implement this strategy to learn about their specific policies and costs.
The chart below shows how to decide what to buy using a simple trading strategy. Buying the strongest stocks or ETFs has a history of delivering market-beating results. This chart shows that small-cap stocks are leading the market and, as the strongest group, they should be bought.
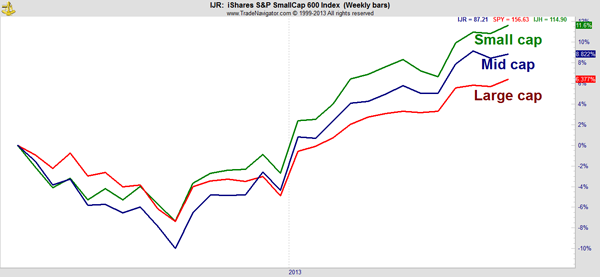
The chart above compares the 26-week rate of change (ROC) of SPDR S&P 500 (SPY), iShares S&P Core MidCap ETF (IJH) and iShares Core S&P SmallCap ETF (IJR). Small caps are leading for now, and that makes them a buy.
The next chart shows IJR in more detail.
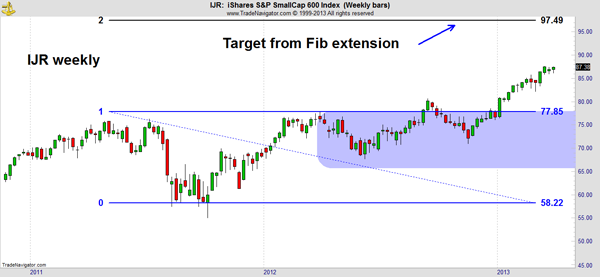
Small caps are usually viewed as more speculative than large-cap stocks, and the fact that small caps are outperforming now is bullish for the broader stock market. Even though there are a number of bullish indicators for stocks, there is no need to ignore risk. Buying IJR and selling calls against the position recognizes the risk of the market and is a step toward reducing that risk.
Each options contract is for 100 shares, so you can sell one covered call for each 100 shares you own. If you buy 100 shares of IJR, you can sell one call contract against those shares. The May $90 calls are attractively priced, so let's run through the math.
IJR is selling for $87.06 a share at the time of this writing, so 100 shares will cost $8,706. A call expiring in May with a strike price of $90 is trading at about $0.55, so selling one contract would create immediate income of $55. The total cost to open this position is $8,651.
If IJR is trading below $90 when the option expires in May, you would keep the premium and earn a profit of 0.6% for a seven-week holding period. This trade could be repeated up to seven times a year and offers potential income of 4.2% a year. With the dividend yield of 1.5% on IJR, you could potentially earn annual income of 5.7%, assuming the dividend remains unchanged.
If IJR is trading above $90 in mid-May, you would have to sell the shares at $90 and earn a profit of 4% over seven weeks.
If you are planning to buy stocks now, consider adding a covered call position to your portfolio to reduce risk and generate immediate income.
Recommended Trade Setup:
-- Buy IJR at $89.25 or below
-- Set stop-loss at $78.50, a support level on the monthly chart
-- Sell one IJR May 90 Call for each 100 shares purchased
-- If IJR is above $90 on May 17, you will have a profit of at least 1.5% in seven weeks
-- If IJR is below $90 on May 17, you will have income of 0.6% for seven weeks
Related Articles
My System Is Warning Traders to Brace for a Pullback
Fast-Food Giant's Breakout Setting Stock Up for a Double-Digit Rally
Billionaires' Battle Creating Immediate Income Opportunity for Average Investors
