Should We Be Cautious About Dynamatic Technologies Limited's (NSE:DYNAMATECH) ROE Of 9.6%?

Many investors are still learning about the various metrics that can be useful when analysing a stock. This article is for those who would like to learn about Return On Equity (ROE). By way of learning-by-doing, we'll look at ROE to gain a better understanding of Dynamatic Technologies Limited (NSE:DYNAMATECH).
Our data shows Dynamatic Technologies has a return on equity of 9.6% for the last year. Another way to think of that is that for every ₹1 worth of equity in the company, it was able to earn ₹0.096.
See our latest analysis for Dynamatic Technologies
How Do You Calculate Return On Equity?
The formula for ROE is:
Return on Equity = Net Profit ÷ Shareholders' Equity
Or for Dynamatic Technologies:
9.6% = ₹312m ÷ ₹3.2b (Based on the trailing twelve months to March 2019.)
It's easy to understand the 'net profit' part of that equation, but 'shareholders' equity' requires further explanation. It is all the money paid into the company from shareholders, plus any earnings retained. Shareholders' equity can be calculated by subtracting the total liabilities of the company from the total assets of the company.
What Does ROE Signify?
ROE measures a company's profitability against the profit it retains, and any outside investments. The 'return' is the profit over the last twelve months. A higher profit will lead to a higher ROE. So, as a general rule, a high ROE is a good thing. Clearly, then, one can use ROE to compare different companies.
Does Dynamatic Technologies Have A Good Return On Equity?
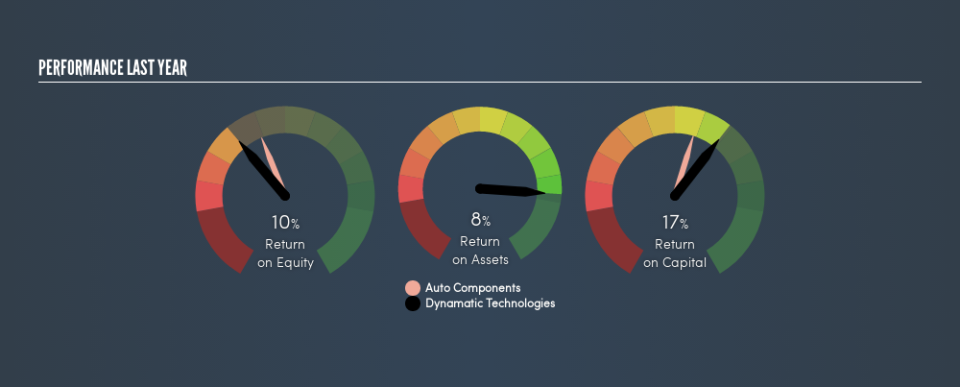
Arguably the easiest way to assess company's ROE is to compare it with the average in its industry. Importantly, this is far from a perfect measure, because companies differ significantly within the same industry classification. As shown in the graphic below, Dynamatic Technologies has a lower ROE than the average (12%) in the Auto Components industry classification.
Unfortunately, that's sub-optimal. We prefer it when the ROE of a company is above the industry average, but it's not the be-all and end-all if it is lower. Nonetheless, it could be useful to double-check if insiders have sold shares recently.
How Does Debt Impact ROE?
Virtually all companies need money to invest in the business, to grow profits. That cash can come from retained earnings, issuing new shares (equity), or debt. In the first two cases, the ROE will capture this use of capital to grow. In the latter case, the use of debt will improve the returns, but will not change the equity. In this manner the use of debt will boost ROE, even though the core economics of the business stay the same.
Combining Dynamatic Technologies's Debt And Its 9.6% Return On Equity
It's worth noting the significant use of debt by Dynamatic Technologies, leading to its debt to equity ratio of 2.03. The company doesn't have a bad ROE, but it is less than ideal tht it has had to use debt to achieve its returns. Debt does bring extra risk, so it's only really worthwhile when a company generates some decent returns from it.
In Summary
Return on equity is one way we can compare the business quality of different companies. In my book the highest quality companies have high return on equity, despite low debt. If two companies have around the same level of debt to equity, and one has a higher ROE, I'd generally prefer the one with higher ROE.
But ROE is just one piece of a bigger puzzle, since high quality businesses often trade on high multiples of earnings. The rate at which profits are likely to grow, relative to the expectations of profit growth reflected in the current price, must be considered, too. So you might want to check this FREE visualization of analyst forecasts for the company.
If you would prefer check out another company -- one with potentially superior financials -- then do not miss this free list of interesting companies, that have HIGH return on equity and low debt.
We aim to bring you long-term focused research analysis driven by fundamental data. Note that our analysis may not factor in the latest price-sensitive company announcements or qualitative material.
If you spot an error that warrants correction, please contact the editor at editorial-team@simplywallst.com. This article by Simply Wall St is general in nature. It does not constitute a recommendation to buy or sell any stock, and does not take account of your objectives, or your financial situation. Simply Wall St has no position in the stocks mentioned. Thank you for reading.
