Cenovus (CVE) Shares Gain 5% Since Reporting Q2 Earnings Beat
Cenovus Energy Inc. CVE shares have gained 5% after reporting better-than-expected second-quarter 2023 earnings on Jul 26. The upward price movement can be attributed to the company’s satisfactory quarterly downstream production.
Q2 Results
Cenovus reported second-quarter earnings per share of 33 cents, beating the Zacks Consensus Estimate by a penny. However, the bottom line declined from the year-ago quarter’s earnings of 93 cents per share.
Total quarterly revenues of $9,106 million missed the Zacks Consensus Estimate of $9,693 million. The top line significantly declined from the year-ago quarter’s $15,018 million.
Better-than-expected quarterly earnings can be primarily attributed to higher contributions from the Canadian Manufacturing unit and lower expenses. The positives were partially offset by lower contributions from the upstream segment.
Cenovus Energy Inc Price, Consensus and EPS Surprise
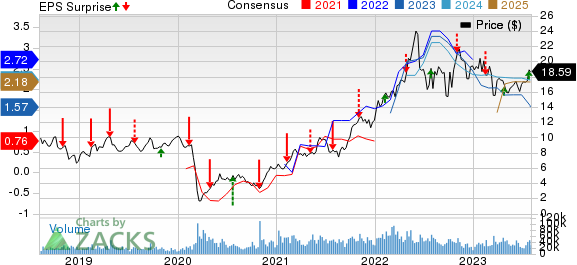
Cenovus Energy Inc price-consensus-eps-surprise-chart | Cenovus Energy Inc Quote
Operational Performance
Upstream
The quarterly operating margin from the Oil Sands unit was C$2,036 million, declining from the C$2,921 million reported a year ago.
In the June-end quarter, the company recorded daily oil sand production of 571.6 thousand barrels, up 2.7% year over year due to lower contribution from its Christina Lake and Sunrise operations. The metric is slightly below our projection of 594.5 thousand barrels.
The operating margin at the Conventional unit was C$73 million, down from C$434 million in the year-ago quarter. The metric is also below our projection of C$295.6 million.
In the second quarter, the company’s daily liquid production of 22.8 thousand barrels decreased 29.2% year over year and also missed our estimate of 40.4 thousand barrels.
The Offshore segment generated an operating margin of C$148 million, down from C$476 million in the year-ago quarter. The metric is also below our projection of C$348 million.
In the quarter under review, the company recorded daily offshore liquid production of 14 thousand barrels, missing our estimate of 21.3 thousand barrels.
Downstream
From the Canadian Manufacturing unit, the company reported an operating margin of C$116 million, up from C$54 million in the year-ago quarter. It recorded Crude Oil processed volumes of 95.3 thousand barrels per day (MBbl/D).
The operating margin from the U.S. Manufacturing unit was C$27 million, down from the year-ago quarter’s C$793 million. The metric is also below our projection of C$196 million. Crude oil processed volumes were 442.5 MBbl/D, an increase from 376.4 MBbl/D in the year-ago quarter.
Expenses
Transportation and blending expenses in the reported quarter declined to C$2,641 million from C$3,050 million a year ago. The cost metric is also below our projection of C$3,060 million.
Also, expenses for purchased products declined to C$5,709 million from C$9,394 million in the prior-year quarter.
Capital Investment & Balance Sheet
The company made a total capital investment of C$1,002 million in the quarter under review.
As of Jun 30, 2023, the Canada-based energy player had cash and cash equivalents of C$2,167 million. Total long-term debt was C$8,534 million.
Outlook
For 2023, Cenovus expects upstream production of 775,000-795,000 barrels of oil-equivalent per day (Boe/d), indicating a decline from the prior-mentioned 790,000-810,000 Boe/d. CVE expects daily oil sand production of 577-637 thousand barrels for the year.
Cenovus expects a downstream throughput volume of 580,000-610,000 barrels per day for 2023.
The company revealed its total capital expenditure guidance of $4-$4.5 billion for the year.
Zacks Rank & Stocks to Consider
Cenovus currently carries a Zacks Rank #5 (Strong Sell).
Investors interested in the energy sector might look at the following companies that presently flaunt a Zacks Rank #1 (Strong Buy). You can see the complete list of today’s Zacks #1 Rank stocks here.
Crestwood Equity Partners LP’s CEQP second-quarter 2023 adjusted earnings of $1.16 per unit, surpassing the Zacks Consensus Estimate of 26 cents. Strong quarterly earnings resulted from fantastic contributions from the Storage and Logistics business unit.
For this year, the partnership projects adjusted EBITDA of $780-$860 million. CEQP has witnessed upward earnings estimate revisions for 2023 and 2024 in the past 60 days.
Oceaneering International, Inc. OII reported a second-quarter 2023 adjusted profit of 18 cents per share, which missed the Zacks Consensus Estimate of 30 cents. This underperformance was due to lower-than-expected operating income from the Subsea Robotics and Manufactured Products segments.
For 2023, Oceaneering projects consolidated EBITDA of $2275-$310 million and a continued free cash flow generation of $90-$130 million. OII has witnessed upward earnings estimate revisions for 2023 and 2024 in the past 60 days.
Evolution Petroleum EPM is an independent energy company. EPM has a Zacks Style Score of A for Growth.
Evolution Petroleum has witnessed upward earnings estimate revisions for 2023 and 2024 in the past 60 days. The consensus estimate for EPM’s 2023 and 2024 earnings per share is pegged at $1.11 and $1.08, respectively.
Want the latest recommendations from Zacks Investment Research? Today, you can download 7 Best Stocks for the Next 30 Days. Click to get this free report
Oceaneering International, Inc. (OII) : Free Stock Analysis Report
Cenovus Energy Inc (CVE) : Free Stock Analysis Report
Evolution Petroleum Corporation, Inc. (EPM) : Free Stock Analysis Report
Crestwood Equity Partners LP (CEQP) : Free Stock Analysis Report
