Centene (CNC) Q2 Earnings Beat Estimates on Membership Growth
Centene Corporation CNC reported second-quarter 2023 adjusted earnings per share (EPS) of $2.10, which beat the Zacks Consensus Estimate by 2.4%. The bottom line advanced 18.6% year over year.
Revenues of CNC amounted to $37,608 million, which improved 4.6% year over year. The top line outpaced the consensus mark by 3.4%.
The better-than-expected quarterly results benefited from growing marketplace membership, business wins and Medicaid growth. However, the positives were partially offset by rising operating expenses.
Centene Corporation Price, Consensus and EPS Surprise
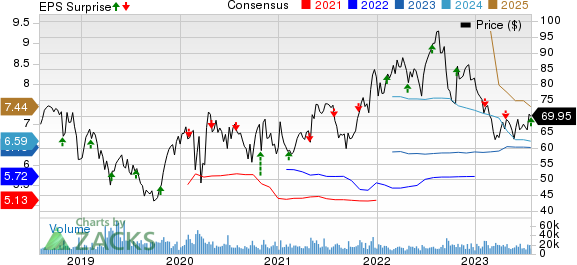
Centene Corporation price-consensus-eps-surprise-chart | Centene Corporation Quote
Quarterly Operational Update
Revenues from Medicaid rose 6.9% year over year in the second quarter, while Medicare revenues grew 0.4% year over year. Meanwhile, commercial revenues climbed 25.9% year over year.
Premiums of Centene improved 7% year over year to $33,713 million, beating our estimate by 3.3%. This was due to solid membership growth of 62% in the Marketplace business as well as organic Medicaid growth.
Service revenues of $1,125 million dropped 54.2% year over year in the quarter under review. The metric lagged our estimate by 1.2%.
The total membership of CNC came in at 28.4 million as of Jun 30, 2023, which increased 7.5% year over year but lagged our estimate by 1.3%.
The Health Benefits Ratio (HBR) of 87% deteriorated 30 basis points (bps) year over year in the second quarter.
Centene reported adjusted net earnings of $1,155 million in the quarter under review, which increased 10.8% year over year.
Total operating expenses of $36,437 million increased 1% year over year. Medical costs rose 7.5% year over year to $29,347 million while selling, general and administrative expenses (SG&A) of $3,016 million escalated 7.7% year over year.
Adjusted SG&A expense ratio deteriorated 40 bps year over year to 8.6% in the second quarter. The metric suffered a blow from an expanding Marketplace business with an increased SG&A ratio.
Financial Update (as of Jun 30, 2023)
Centene exited the second quarter with cash and cash equivalents of $17,170 million, which climbed from $12,074 at 2022-end. Total assets of $82,853 million increased from $76,870 at 2022-end.
Long-term debt amounted to $17,896 million, down from $17,938 million at 2022-end. The current portion of long-term debt amounted to $110 million.
Total stockholders’ equity of $25,768 million grew from $24,181 million at 2022-end.
In the reported quarter, the operating cash flow of $2,546 million decreased 24.1% year over year.
Share Repurchase Update
Centene bought back 6 million shares worth $400 million in the second quarter. The company bought back additional 4.5 million shares for $300 million in July. As of Jul 28, 2023, CNC had a leftover share buyback capacity of $1.7 billion.
2023 Guidance Revised
Premium and service revenues are currently forecasted to be between $137 billion and $139 billion, higher than the prior outlook of $135.2-$137.2 billion. The mid-point of the revised outlook indicates a rise of 1.8% from the 2022 reported figure.
Revenues are estimated to be between $147.3 billion and $149.3 billion, up from the previous guidance of $144.5-$146.5 billion. The midpoint of the revised outlook implies a 2.6% improvement from the 2022 figure.
Management anticipates adjusted EPS to register a minimum of $6.45 this year, while the earlier view called for the metric to be $6.40. The updated outlook suggests a minimum growth of 11.6% from the 2022 figure.
The company reaffirmed its previous guidance for the following metrics, HBR in the band of 87.1-87.7%, adjusted SG&A expense ratio within 8.7-9.1% and adjusted effective tax rate of 24.1-25.1%.
Diluted shares outstanding are anticipated to be in the range of 546.6-549.6 million.
2024 Outlook Reaffirmed
On the basis of an updated view of Medicaid redeterminations, Medicare bid strategy, and business investments, management estimates adjusted EPS to stay higher than $6.60 in 2024.
Zacks Rank
Centene currently carries a Zacks Rank #3 (Hold). You can see the complete list of today’s Zacks #1 Rank (Strong Buy) stocks here.
Other Medical Sector Releases
Of the Medical sector players that have reported second-quarter results so far, the bottom lines of Elevance Health, Inc. ELV, UnitedHealth Group Incorporated UNH and Universal Health Services, Inc. UHS beat the Zacks Consensus Estimate.
Elevance Health reported second-quarter 2023 adjusted net income of $9.04 per share, which outpaced the Zacks Consensus Estimate by 2.5%. The bottom line improved 13.4% year over year.
ELV’s operating revenues, which amounted to $43,377 million, rose 12.7% year over year in the quarter under review. The top line surpassed the consensus mark by 4.5%.
UnitedHealth Group reported second-quarter 2023 adjusted EPS of $6.14, which outpaced the Zacks Consensus Estimate by 3.7%. The bottom line advanced 10.2% year over year.
Revenues improved 16% year over year to $92.9 billion in the quarter under review, attributable to sound contributions made by the UnitedHealthcare and Optum business lines. The top line surpassed the consensus mark by 2.5%.
Universal Health reported second-quarter 2023 adjusted EPS of $2.53, which outpaced the Zacks Consensus Estimate by 2%. The bottom line advanced 15% year over year.
UHS’s operating revenues, which amounted to $3.6 billion, rose 6.9% year over year in the quarter under review. The top line surpassed the consensus mark by 1.3%.
Want the latest recommendations from Zacks Investment Research? Today, you can download 7 Best Stocks for the Next 30 Days. Click to get this free report
UnitedHealth Group Incorporated (UNH) : Free Stock Analysis Report
Universal Health Services, Inc. (UHS) : Free Stock Analysis Report
Centene Corporation (CNC) : Free Stock Analysis Report
Elevance Health, Inc. (ELV) : Free Stock Analysis Report
