New Century Group Hong Kong Limited (HKG:234) Might Not Be A Great Investment

Today we are going to look at New Century Group Hong Kong Limited (HKG:234) to see whether it might be an attractive investment prospect. Specifically, we're going to calculate its Return On Capital Employed (ROCE), in the hopes of getting some insight into the business.
First, we'll go over how we calculate ROCE. Second, we'll look at its ROCE compared to similar companies. Finally, we'll look at how its current liabilities affect its ROCE.
What is Return On Capital Employed (ROCE)?
ROCE measures the amount of pre-tax profits a company can generate from the capital employed in its business. All else being equal, a better business will have a higher ROCE. Ultimately, it is a useful but imperfect metric. Author Edwin Whiting says to be careful when comparing the ROCE of different businesses, since 'No two businesses are exactly alike.
So, How Do We Calculate ROCE?
The formula for calculating the return on capital employed is:
Return on Capital Employed = Earnings Before Interest and Tax (EBIT) ÷ (Total Assets - Current Liabilities)
Or for New Century Group Hong Kong:
0.021 = HK$43m ÷ (HK$2.3b - HK$196m) (Based on the trailing twelve months to September 2019.)
So, New Century Group Hong Kong has an ROCE of 2.1%.
View our latest analysis for New Century Group Hong Kong
Does New Century Group Hong Kong Have A Good ROCE?
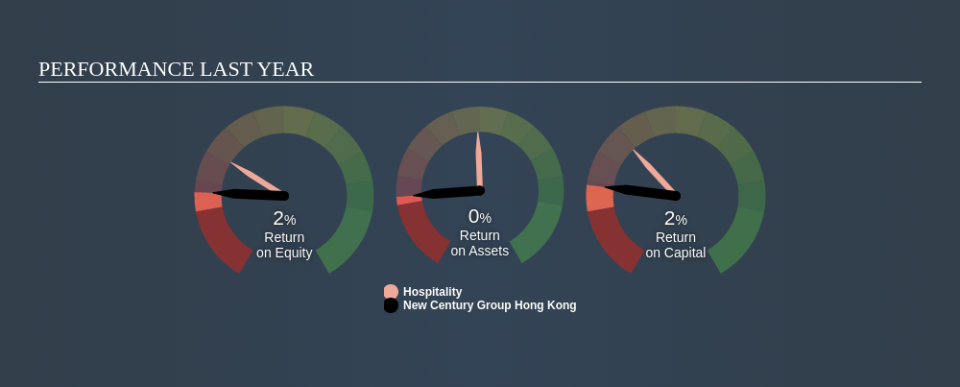
ROCE can be useful when making comparisons, such as between similar companies. We can see New Century Group Hong Kong's ROCE is meaningfully below the Hospitality industry average of 5.2%. This performance is not ideal, as it suggests the company may not be deploying its capital as effectively as some competitors. Independently of how New Century Group Hong Kong compares to its industry, its ROCE in absolute terms is low; especially compared to the ~1.6% available in government bonds. There are potentially more appealing investments elsewhere.
New Century Group Hong Kong's current ROCE of 2.1% is lower than 3 years ago, when the company reported a 6.9% ROCE. So investors might consider if it has had issues recently. You can click on the image below to see (in greater detail) how New Century Group Hong Kong's past growth compares to other companies.
When considering this metric, keep in mind that it is backwards looking, and not necessarily predictive. ROCE can be deceptive for cyclical businesses, as returns can look incredible in boom times, and terribly low in downturns. ROCE is, after all, simply a snap shot of a single year. If New Century Group Hong Kong is cyclical, it could make sense to check out this free graph of past earnings, revenue and cash flow.
How New Century Group Hong Kong's Current Liabilities Impact Its ROCE
Liabilities, such as supplier bills and bank overdrafts, are referred to as current liabilities if they need to be paid within 12 months. The ROCE equation subtracts current liabilities from capital employed, so a company with a lot of current liabilities appears to have less capital employed, and a higher ROCE than otherwise. To counter this, investors can check if a company has high current liabilities relative to total assets.
New Century Group Hong Kong has total assets of HK$2.3b and current liabilities of HK$196m. As a result, its current liabilities are equal to approximately 8.6% of its total assets. New Century Group Hong Kong has a low level of current liabilities, which have a negligible impact on its already low ROCE.
Our Take On New Century Group Hong Kong's ROCE
Nonetheless, there may be better places to invest your capital. Of course, you might find a fantastic investment by looking at a few good candidates. So take a peek at this free list of companies with modest (or no) debt, trading on a P/E below 20.
If you like to buy stocks alongside management, then you might just love this free list of companies. (Hint: insiders have been buying them).
If you spot an error that warrants correction, please contact the editor at editorial-team@simplywallst.com. This article by Simply Wall St is general in nature. It does not constitute a recommendation to buy or sell any stock, and does not take account of your objectives, or your financial situation. Simply Wall St has no position in the stocks mentioned.
We aim to bring you long-term focused research analysis driven by fundamental data. Note that our analysis may not factor in the latest price-sensitive company announcements or qualitative material. Thank you for reading.
