CF Industries Holdings (CF): A Comprehensive Analysis of Its Market Value
CF Industries Holdings (NYSE:CF) experienced a daily gain of 1.31%, with a three-month gain of 16.9%. The company's Earnings Per Share (EPS) stands at 12.08. But the question remains: is the stock fairly valued? This article aims to provide an in-depth analysis of CF Industries Holdings' valuation. Let's dive into the financials.
Introducing CF Industries Holdings
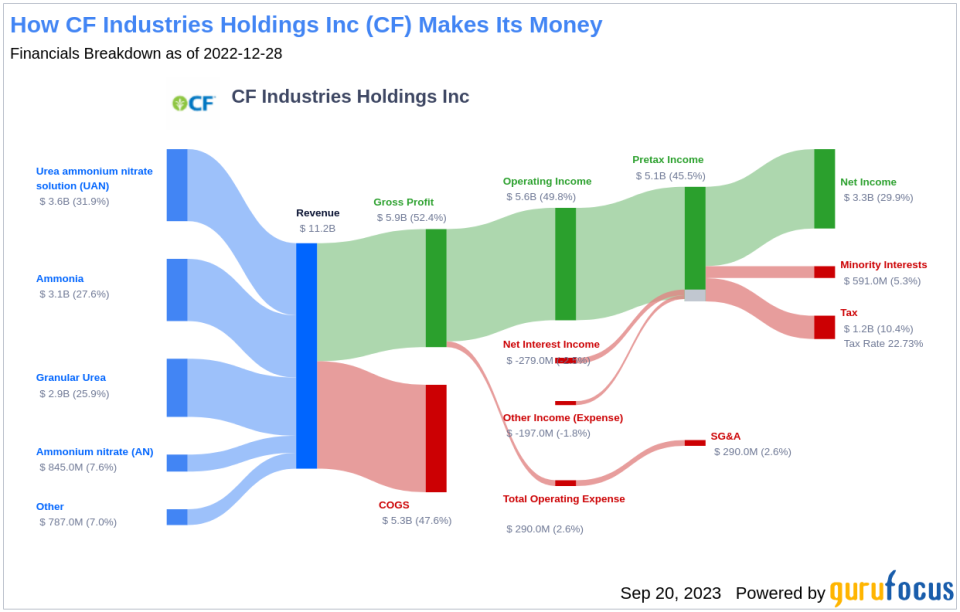
CF Industries Holdings Inc (NYSE:CF) is a leading producer and distributor of nitrogen fertilizers. The company operates seven nitrogen facilities in North America and holds joint venture interests in further production capacity in the United Kingdom and Trinidad and Tobago. CF makes nitrogen primarily using low-cost U.S. natural gas as its feedstock, making CF one of the lowest-cost nitrogen producers globally. The company is also investing in carbon-free blue and green ammonia, which can be used an alternative fuel to hydrogen or as a means to transport hydrogen.
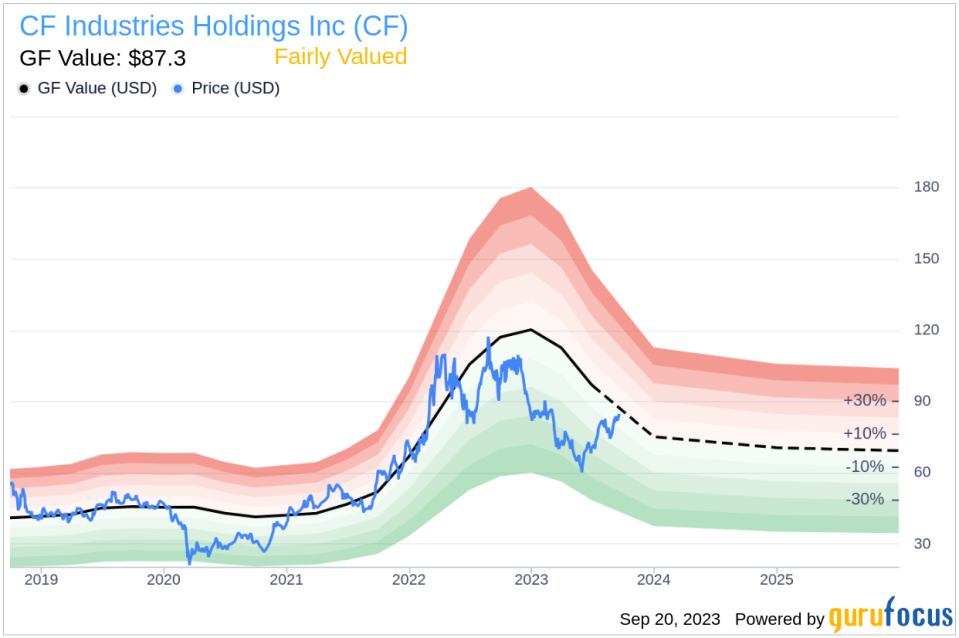
Currently, the stock price of CF Industries Holdings is $83.99, with a market cap of $16.20 billion. The company's GF Value, an estimation of fair value, is $87.3. This suggests that the stock is fairly valued. The following analysis will provide a deeper understanding of the company's value.
Understanding the GF Value
The GF Value is a proprietary measure that represents the current intrinsic value of a stock. It is calculated based on historical trading multiples, a GuruFocus adjustment factor based on past performance and growth, and future business performance estimates. The GF Value Line on our summary page provides an overview of the fair value at which the stock should ideally be traded.
According to GuruFocus Value calculation, CF Industries Holdings appears to be fairly valued. This suggests that the long-term return of its stock is likely to be close to the rate of its business growth.
Link: These companies may deliver higher future returns at reduced risk.
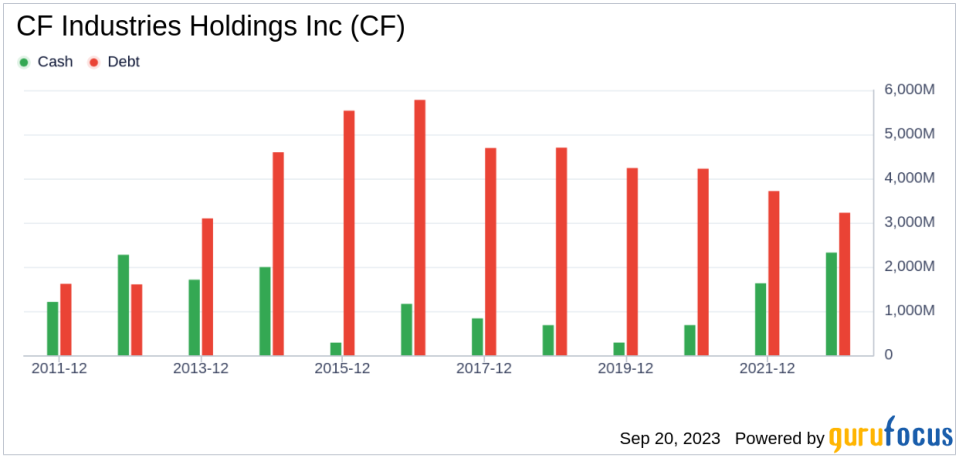
Financial Strength
Investing in companies with low financial strength could result in permanent capital loss. Therefore, it's crucial to review a company's financial strength before deciding to buy shares. CF Industries Holdings has a cash-to-debt ratio of 0.99, which ranks better than 58.09% of 241 companies in the Agriculture industry. Based on this, GuruFocus ranks CF Industries Holdings's financial strength as 7 out of 10, suggesting a fair balance sheet.
Profitability and Growth
Investing in profitable companies, especially those with consistent profitability over the long term, is usually less risky. CF Industries Holdings has been profitable 9 out of the past 10 years. Over the past twelve months, the company had a revenue of $8.70 billion and Earnings Per Share (EPS) of $12.08. Its operating margin is 41.09%, which ranks better than 94.94% of 237 companies in the Agriculture industry. Overall, the profitability of CF Industries Holdings is ranked 9 out of 10, which indicates strong profitability.
One of the most important factors in the valuation of a company is growth. Companies that grow faster create more value for shareholders, especially if that growth is profitable. The average annual revenue growth of CF Industries Holdings is 38.3%, which ranks better than 84.82% of 224 companies in the Agriculture industry. The 3-year average EBITDA growth is 53.9%, which ranks better than 85.05% of 214 companies in the Agriculture industry.
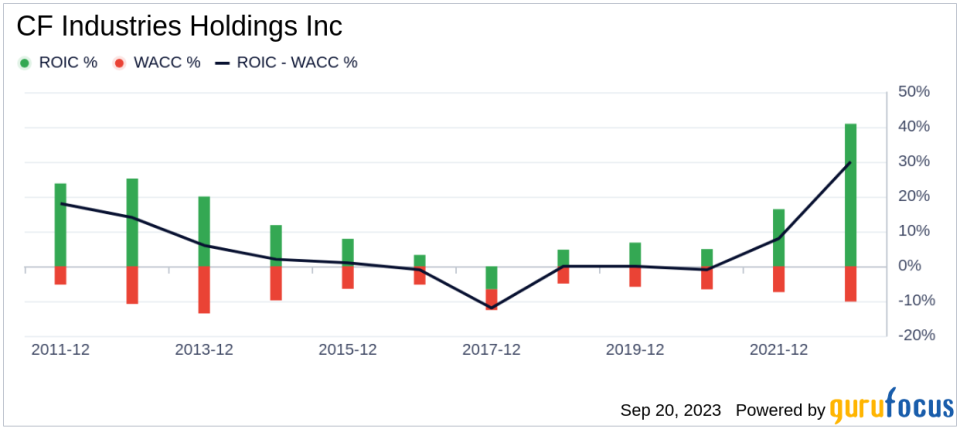
ROIC vs WACC
Another method of determining the profitability of a company is to compare its return on invested capital to the weighted average cost of capital. Return on invested capital (ROIC) measures how well a company generates cash flow relative to the capital it has invested in its business. The weighted average cost of capital (WACC) is the rate that a company is expected to pay on average to all its security holders to finance its assets. When the ROIC is higher than the WACC, it implies the company is creating value for shareholders. For the past 12 months, CF Industries Holdings's return on invested capital is 28.16, and its cost of capital is 10.31.
Conclusion
In conclusion, the stock of CF Industries Holdings appears to be fairly valued. The company's financial condition is fair and its profitability is strong. Its growth ranks better than 85.05% of 214 companies in the Agriculture industry. To learn more about CF Industries Holdings stock, you can check out its 30-Year Financials here.
To find out the high-quality companies that may deliver above-average returns, please check out GuruFocus High Quality Low Capex Screener.
This article first appeared on GuruFocus.
