CF Industries Holdings (CF): A Comprehensive Analysis of Its Market Value
CF Industries Holdings Inc (NYSE:CF) has experienced a daily gain of 4.36% and a 3-month gain of 30%. With an Earnings Per Share (EPS) (EPS) of 12.08, the question arises: is the stock fairly valued? This article will delve into a detailed valuation analysis of CF Industries Holdings, providing valuable insights for potential investors.
Company Introduction
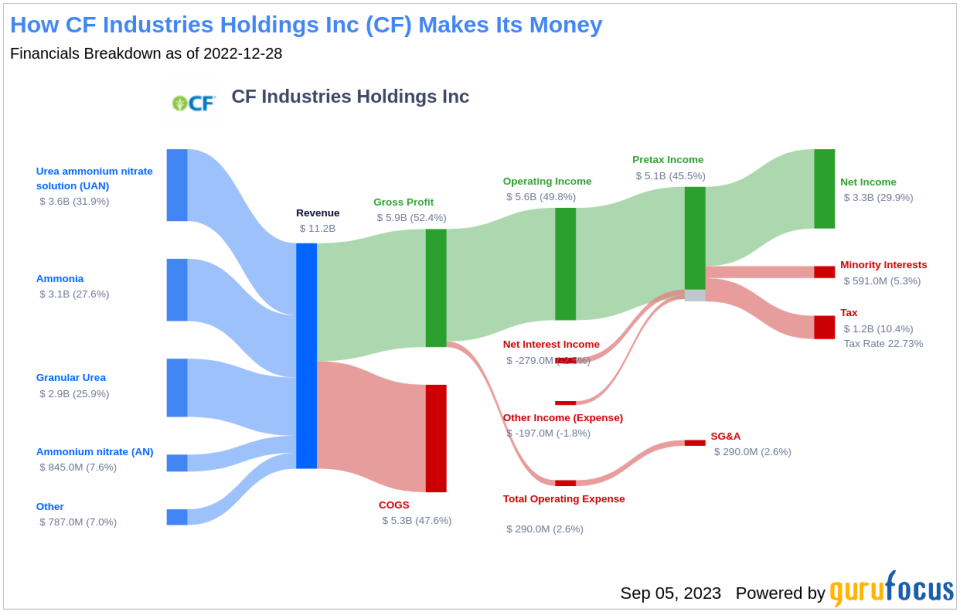
CF Industries Holdings Inc, a leading producer and distributor of nitrogen fertilizers, operates seven nitrogen facilities in North America and holds joint venture interests in the United Kingdom and Trinidad and Tobago. The company primarily uses low-cost U.S. natural gas as its feedstock, making it one of the lowest-cost nitrogen producers globally. CF Industries Holdings is also investing in carbon-free blue and green ammonia, an alternative fuel to hydrogen or a means to transport hydrogen.
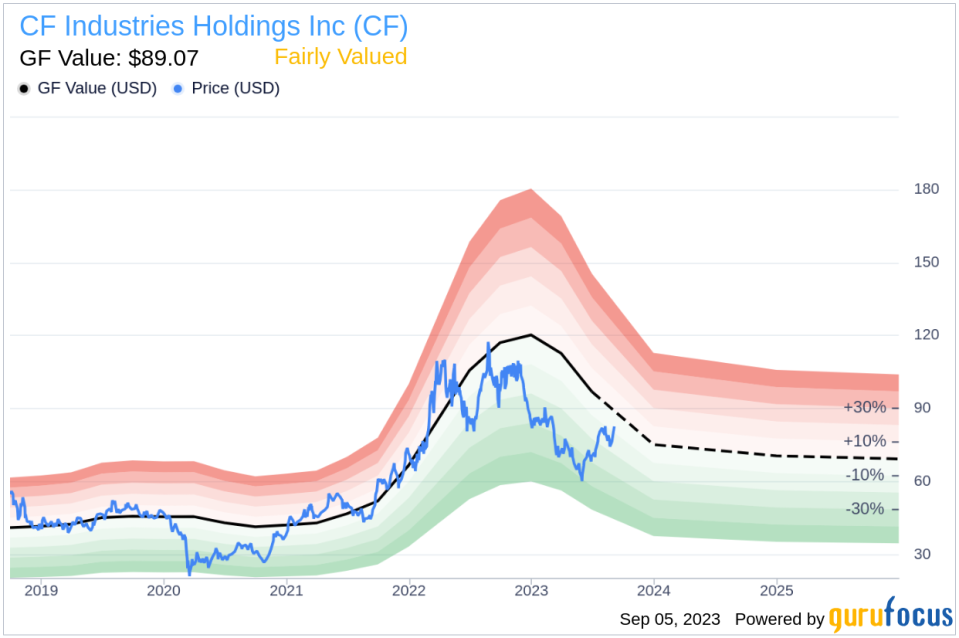
At its current price of $82.66 per share, CF Industries Holdings has a market cap of $15.90 billion. The GF Value, an estimation of the company's fair value, is $89.07. This comparison sets the stage for a deeper exploration of the company's value.
Summarizing the GF Value
The GF Value represents the current intrinsic value of a stock, derived from GuruFocus' exclusive method. It is calculated based on historical trading multiples, the GuruFocus adjustment factor based on the company's past returns and growth, and future estimates of the business performance. The GF Value Line on our summary page gives an overview of the fair value that the stock should be traded at.
CF Industries Holdings (NYSE:CF) stock is estimated to be fairly valued based on the GuruFocus Value calculation. If the price of a stock is significantly above the GF Value Line, it is overvalued and its future return is likely to be poor. On the other hand, if it is significantly below the GF Value Line, its future return will likely be higher. Therefore, as CF Industries Holdings is fairly valued, the long-term return of its stock is likely to be close to the rate of its business growth.
Link: These companies may deliver higher future returns at reduced risk.
Financial Strength
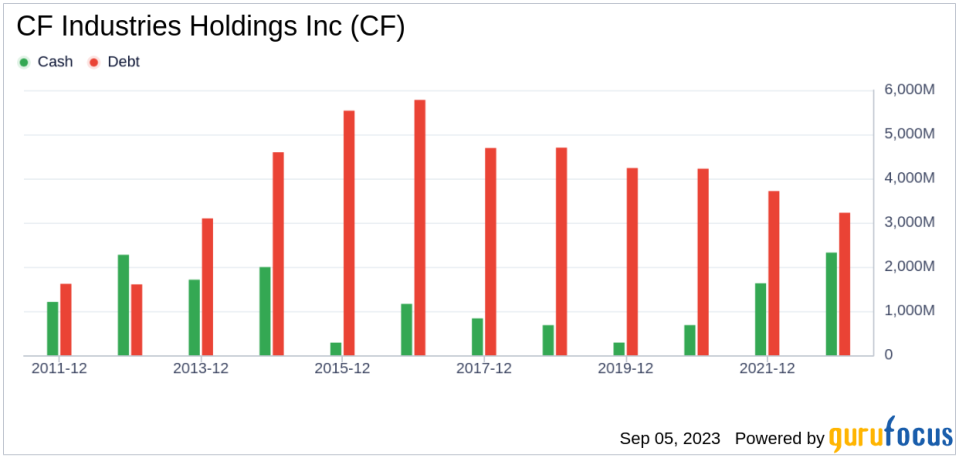
Investing in companies with poor financial strength has a higher risk of permanent loss of capital. Thus, it is important to carefully review the financial strength of a company before deciding whether to buy its stock. Looking at the cash-to-debt ratio and interest coverage is a great starting point for understanding the financial strength of a company. CF Industries Holdings has a cash-to-debt ratio of 0.99, which is better than 57.81% of 237 companies in the Agriculture industry. GuruFocus ranks the overall financial strength of CF Industries Holdings at 7 out of 10, which indicates that the financial strength of CF Industries Holdings is fair.
Profitability and Growth
Companies that have been consistently profitable over the long term offer less risk for investors who may want to purchase shares. Higher profit margins usually dictate a better investment compared to a company with lower profit margins. CF Industries Holdings has been profitable 9 over the past 10 years. Over the past twelve months, the company had a revenue of $8.70 billion and Earnings Per Share (EPS) of $12.08. Its operating margin is 41.09%, which ranks better than 95.63% of 229 companies in the Agriculture industry. Overall, the profitability of CF Industries Holdings is ranked 9 out of 10, which indicates strong profitability.
Growth is probably the most important factor in the valuation of a company. GuruFocus research has found that growth is closely correlated with the long term stock performance of a company. A faster growing company creates more value for shareholders, especially if the growth is profitable. The 3-year average annual revenue growth of CF Industries Holdings is 38.3%, which ranks better than 83.49% of 218 companies in the Agriculture industry. The 3-year average EBITDA growth rate is 53.9%, which ranks better than 84.13% of 208 companies in the Agriculture industry.
ROIC vs WACC
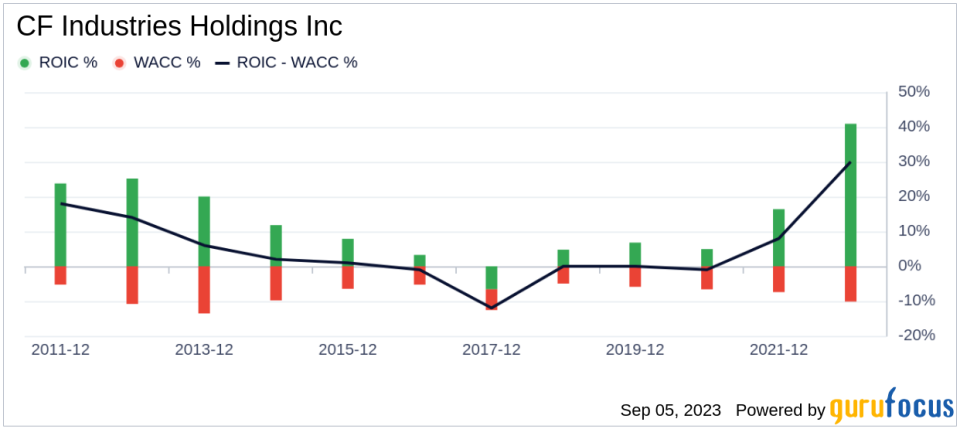
One can also evaluate a company's profitability by comparing its return on invested capital (ROIC) to its weighted average cost of capital (WACC). Return on invested capital (ROIC) measures how well a company generates cash flow relative to the capital it has invested in its business. The weighted average cost of capital (WACC) is the rate that a company is expected to pay on average to all its security holders to finance its assets. If the return on invested capital exceeds the weighted average cost of capital, the company is likely creating value for its shareholders. During the past 12 months, CF Industries Holdings's ROIC is 28.16 while its WACC came in at 10.19.
Conclusion
In short, the stock of CF Industries Holdings (NYSE:CF) is estimated to be fairly valued. The company's financial condition is fair and its profitability is strong. Its growth ranks better than 84.13% of 208 companies in the Agriculture industry. To learn more about CF Industries Holdings stock, you can check out its 30-Year Financials here.
To find out the high quality companies that may deliver above average returns, please check out GuruFocus High Quality Low Capex Screener.
This article first appeared on GuruFocus.
