Charter Hall Long WALE REIT (ASX:CLW investor three-year losses grow to 27% as the stock sheds AU$166m this past week
As an investor its worth striving to ensure your overall portfolio beats the market average. But the risk of stock picking is that you will likely buy under-performing companies. We regret to report that long term Charter Hall Long WALE REIT (ASX:CLW) shareholders have had that experience, with the share price dropping 40% in three years, versus a market return of about 29%. Shareholders have had an even rougher run lately, with the share price down 23% in the last 90 days.
Since Charter Hall Long WALE REIT has shed AU$166m from its value in the past 7 days, let's see if the longer term decline has been driven by the business' economics.
See our latest analysis for Charter Hall Long WALE REIT
To paraphrase Benjamin Graham: Over the short term the market is a voting machine, but over the long term it's a weighing machine. One way to examine how market sentiment has changed over time is to look at the interaction between a company's share price and its earnings per share (EPS).
Over the three years that the share price declined, Charter Hall Long WALE REIT's earnings per share (EPS) dropped significantly, falling to a loss. Extraordinary items contributed to this situation. Since the company has fallen to a loss making position, it's hard to compare the change in EPS with the share price change. But it's safe to say we'd generally expect the share price to be lower as a result!
You can see how EPS has changed over time in the image below (click on the chart to see the exact values).
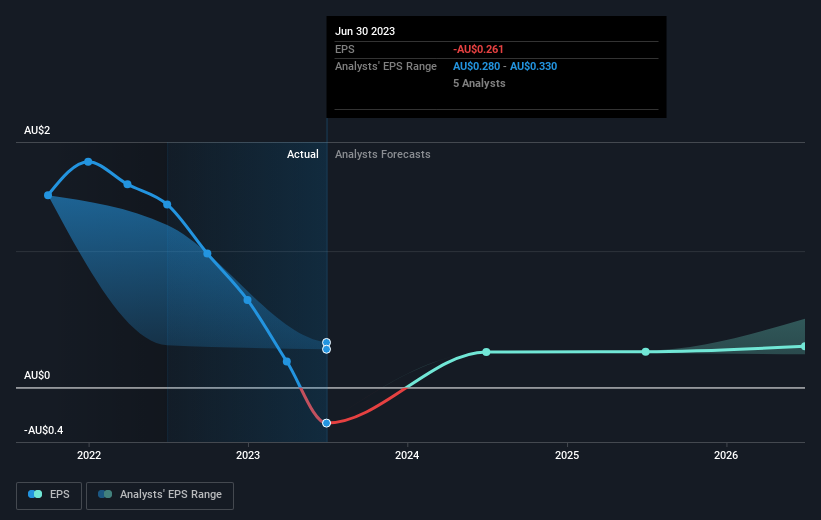
It might be well worthwhile taking a look at our free report on Charter Hall Long WALE REIT's earnings, revenue and cash flow.
What About Dividends?
It is important to consider the total shareholder return, as well as the share price return, for any given stock. The TSR is a return calculation that accounts for the value of cash dividends (assuming that any dividend received was reinvested) and the calculated value of any discounted capital raisings and spin-offs. Arguably, the TSR gives a more comprehensive picture of the return generated by a stock. In the case of Charter Hall Long WALE REIT, it has a TSR of -27% for the last 3 years. That exceeds its share price return that we previously mentioned. And there's no prize for guessing that the dividend payments largely explain the divergence!
A Different Perspective
Charter Hall Long WALE REIT shareholders are down 19% for the year (even including dividends), but the market itself is up 4.7%. However, keep in mind that even the best stocks will sometimes underperform the market over a twelve month period. Longer term investors wouldn't be so upset, since they would have made 0.3%, each year, over five years. It could be that the recent sell-off is an opportunity, so it may be worth checking the fundamental data for signs of a long term growth trend. I find it very interesting to look at share price over the long term as a proxy for business performance. But to truly gain insight, we need to consider other information, too. Case in point: We've spotted 2 warning signs for Charter Hall Long WALE REIT you should be aware of.
We will like Charter Hall Long WALE REIT better if we see some big insider buys. While we wait, check out this free list of growing companies with considerable, recent, insider buying.
Please note, the market returns quoted in this article reflect the market weighted average returns of stocks that currently trade on Australian exchanges.
Have feedback on this article? Concerned about the content? Get in touch with us directly. Alternatively, email editorial-team (at) simplywallst.com.
This article by Simply Wall St is general in nature. We provide commentary based on historical data and analyst forecasts only using an unbiased methodology and our articles are not intended to be financial advice. It does not constitute a recommendation to buy or sell any stock, and does not take account of your objectives, or your financial situation. We aim to bring you long-term focused analysis driven by fundamental data. Note that our analysis may not factor in the latest price-sensitive company announcements or qualitative material. Simply Wall St has no position in any stocks mentioned.
