The Chemours Co's Dividend Analysis
Insights into The Chemours Co's Upcoming Dividend and Financial Health
The Chemours Co (NYSE:CC) recently announced a dividend of $0.25 per share, payable on 2024-03-15, with the ex-dividend date set for 2024-02-23. As investors look forward to this upcoming payment, the spotlight also shines on the company's dividend history, yield, and growth rates. Using the data from GuruFocus, let's look into The Chemours Co's dividend performance and assess its sustainability.
What Does The Chemours Co Do?
This Powerful Chart Made Peter Lynch 29% A Year For 13 Years
How to calculate the intrinsic value of a stock?
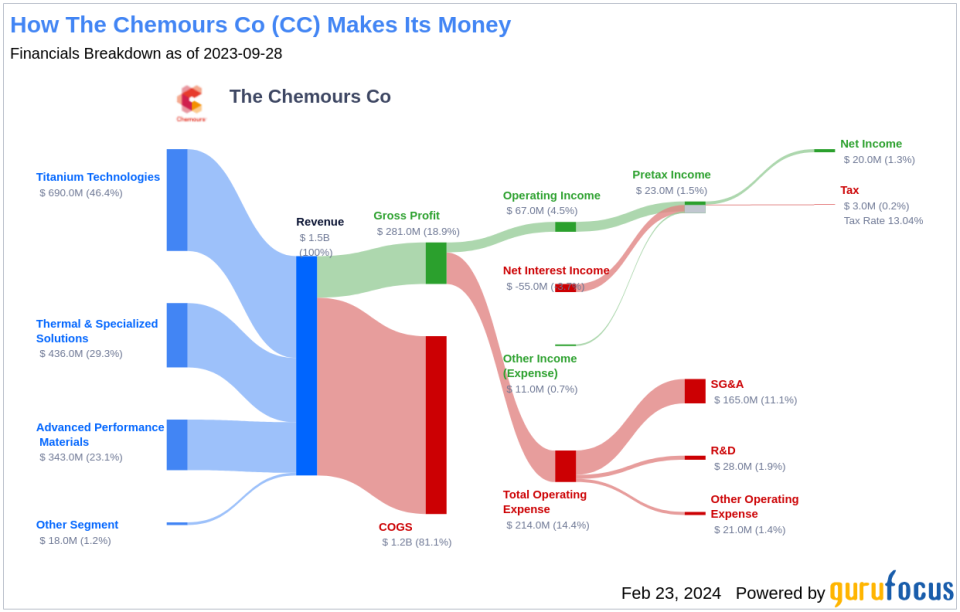
The Chemours Co is a global provider of chemicals. It delivers customized solutions with a wide range of industrial and specialty chemicals products for various markets including coatings, plastics, refrigeration, and air conditioning. The company's operating segments include Titanium Technologies, Thermal & Specialized Solutions, and Advanced Performance Materials. It generates maximum revenue from the Titanium Technologies segment. The Titanium Technologies segment is a producer of TiO2 pigment, a premium white pigment used to deliver whiteness, brightness, opacity, durability, efficiency, and protection across a variety of applications. Geographically, it derives a majority of its revenue from North America.
A Glimpse at The Chemours Co's Dividend History
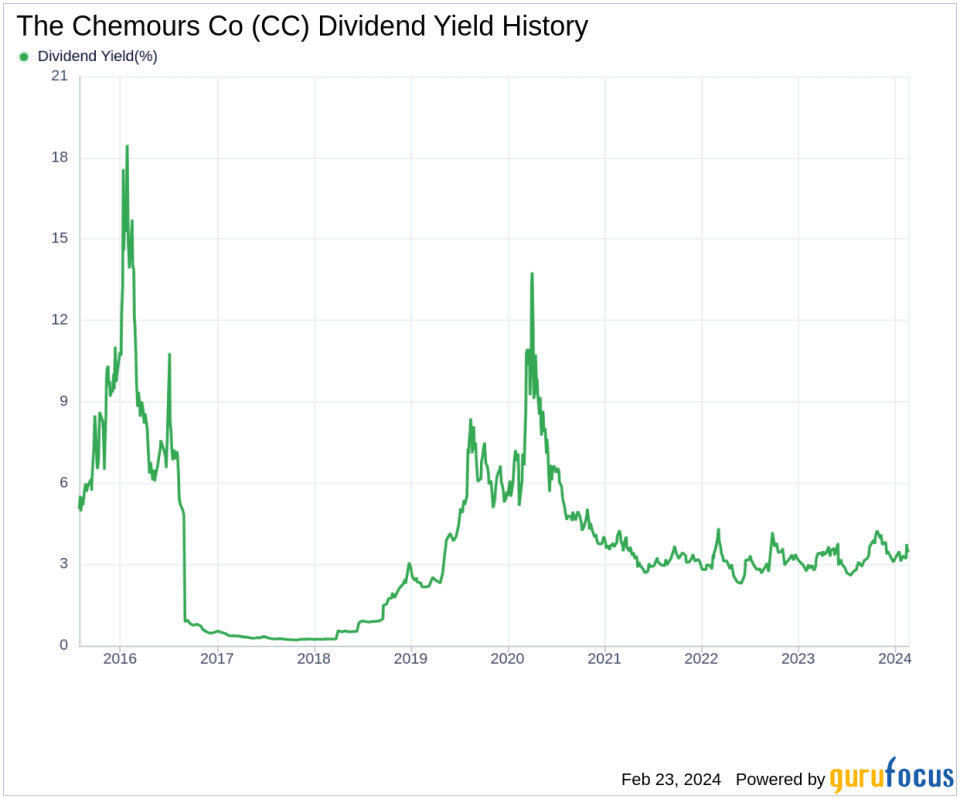
The Chemours Co has maintained a consistent dividend payment record since 2015. Dividends are currently distributed on a quarterly basis. Below is a chart showing annual Dividends Per Share for tracking historical trends.
Breaking Down The Chemours Co's Dividend Yield and Growth
As of today, The Chemours Co currently has a 12-month trailing dividend yield of 3.37% and a 12-month forward dividend yield of 3.37%. This suggests an expectation of same dividend payments over the next 12 months. Extended to a five-year horizon, this rate increased to 37.40% per year. Based on The Chemours Co's dividend yield and five-year growth rate, the 5-year yield on cost of The Chemours Co stock as of today is approximately 16.50%.
The Sustainability Question: Payout Ratio and Profitability
To assess the sustainability of the dividend, one needs to evaluate the company's payout ratio. The dividend payout ratio provides insights into the portion of earnings the company distributes as dividends. A lower ratio suggests that the company retains a significant part of its earnings, thereby ensuring the availability of funds for future growth and unexpected downturns. As of 2023-09-30, The Chemours Co's dividend payout ratio is 0.36. The Chemours Co's profitability rank, offers an understanding of the company's earnings prowess relative to its peers. GuruFocus ranks The Chemours Co's profitability 6 out of 10 as of 2023-09-30, suggesting fair profitability. The company has reported net profit in 8 years out of the past 10 years.
Growth Metrics: The Future Outlook
To ensure the sustainability of dividends, a company must have robust growth metrics. The Chemours Co's growth rank of 6 out of 10 suggests that the company has a fair growth outlook. The Chemours Co's revenue per share, combined with the 3-year revenue growth rate, indicates a strong revenue model. The Chemours Co's revenue has increased by approximately 8.60% per year on average, a rate that underperforms approximately 53.72% of global competitors. The company's 3-year EPS growth rate showcases its capability to grow its earnings, a critical component for sustaining dividends in the long run. During the past three years, The Chemours Co's earnings increased by approximately 22.90% per year on average, a rate that underperforms approximately 35.82% of global competitors. Lastly, the company's 5-year EBITDA growth rate of -0.80%, which underperforms approximately 74.45% of global competitors.
Next Steps
In conclusion, The Chemours Co's consistent dividend payments, coupled with a modest dividend growth rate, present an attractive proposition for income-focused investors. The company's payout ratio and profitability rank reflect a balanced approach to dividend distributions and earnings retention. However, The Chemours Co's growth metrics indicate mixed performance, with revenue growth lagging behind a significant number of global competitors, which could be a concern for long-term dividend sustainability. Investors should weigh these factors and consider The Chemours Co's overall financial health and market position when evaluating the stock for their portfolios. GuruFocus Premium users can screen for high-dividend yield stocks using the High Dividend Yield Screener.
This article, generated by GuruFocus, is designed to provide general insights and is not tailored financial advice. Our commentary is rooted in historical data and analyst projections, utilizing an impartial methodology, and is not intended to serve as specific investment guidance. It does not formulate a recommendation to purchase or divest any stock and does not consider individual investment objectives or financial circumstances. Our objective is to deliver long-term, fundamental data-driven analysis. Be aware that our analysis might not incorporate the most recent, price-sensitive company announcements or qualitative information. GuruFocus holds no position in the stocks mentioned herein.
This article first appeared on GuruFocus.
