Is Chemring Group PLC's (LON:CHG) Recent Performance Tethered To Its Attractive Financial Prospects?
Chemring Group's (LON:CHG) stock up by 8.6% over the past three months. Given that the market rewards strong financials in the long-term, we wonder if that is the case in this instance. Particularly, we will be paying attention to Chemring Group's ROE today.
Return on equity or ROE is an important factor to be considered by a shareholder because it tells them how effectively their capital is being reinvested. Put another way, it reveals the company's success at turning shareholder investments into profits.
See our latest analysis for Chemring Group
How Do You Calculate Return On Equity?
The formula for return on equity is:
Return on Equity = Net Profit (from continuing operations) ÷ Shareholders' Equity
So, based on the above formula, the ROE for Chemring Group is:
9.9% = UK£40m ÷ UK£400m (Based on the trailing twelve months to April 2023).
The 'return' is the profit over the last twelve months. Another way to think of that is that for every £1 worth of equity, the company was able to earn £0.10 in profit.
Why Is ROE Important For Earnings Growth?
We have already established that ROE serves as an efficient profit-generating gauge for a company's future earnings. We now need to evaluate how much profit the company reinvests or "retains" for future growth which then gives us an idea about the growth potential of the company. Generally speaking, other things being equal, firms with a high return on equity and profit retention, have a higher growth rate than firms that don’t share these attributes.
Chemring Group's Earnings Growth And 9.9% ROE
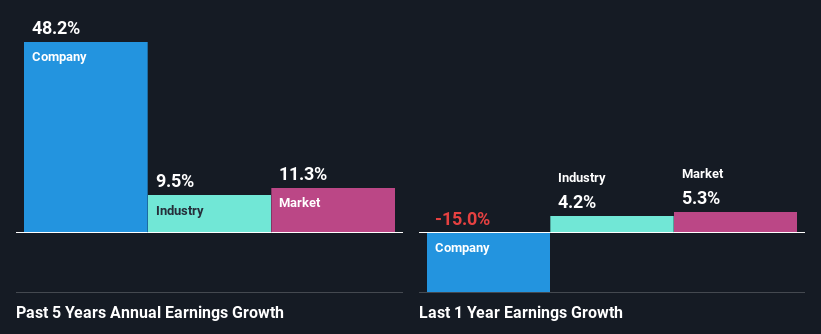
To start with, Chemring Group's ROE looks acceptable. Even when compared to the industry average of 10% the company's ROE looks quite decent. This probably goes some way in explaining Chemring Group's significant 48% net income growth over the past five years amongst other factors. We reckon that there could also be other factors at play here. For example, it is possible that the company's management has made some good strategic decisions, or that the company has a low payout ratio.
We then compared Chemring Group's net income growth with the industry and we're pleased to see that the company's growth figure is higher when compared with the industry which has a growth rate of 9.5% in the same 5-year period.
The basis for attaching value to a company is, to a great extent, tied to its earnings growth. It’s important for an investor to know whether the market has priced in the company's expected earnings growth (or decline). Doing so will help them establish if the stock's future looks promising or ominous. What is CHG worth today? The intrinsic value infographic in our free research report helps visualize whether CHG is currently mispriced by the market.
Is Chemring Group Efficiently Re-investing Its Profits?
The three-year median payout ratio for Chemring Group is 32%, which is moderately low. The company is retaining the remaining 68%. This suggests that its dividend is well covered, and given the high growth we discussed above, it looks like Chemring Group is reinvesting its earnings efficiently.
Besides, Chemring Group has been paying dividends for at least ten years or more. This shows that the company is committed to sharing profits with its shareholders. Upon studying the latest analysts' consensus data, we found that the company's future payout ratio is expected to rise to 38% over the next three years. However, the company's ROE is not expected to change by much despite the higher expected payout ratio.
Summary
On the whole, we feel that Chemring Group's performance has been quite good. Particularly, we like that the company is reinvesting heavily into its business, and at a high rate of return. Unsurprisingly, this has led to an impressive earnings growth. With that said, the latest industry analyst forecasts reveal that the company's earnings growth is expected to slow down. To know more about the latest analysts predictions for the company, check out this visualization of analyst forecasts for the company.
Have feedback on this article? Concerned about the content? Get in touch with us directly. Alternatively, email editorial-team (at) simplywallst.com.
This article by Simply Wall St is general in nature. We provide commentary based on historical data and analyst forecasts only using an unbiased methodology and our articles are not intended to be financial advice. It does not constitute a recommendation to buy or sell any stock, and does not take account of your objectives, or your financial situation. We aim to bring you long-term focused analysis driven by fundamental data. Note that our analysis may not factor in the latest price-sensitive company announcements or qualitative material. Simply Wall St has no position in any stocks mentioned.
