Is China Zhongwang Holdings Limited’s (HKG:1333) P/E Ratio Really That Good?

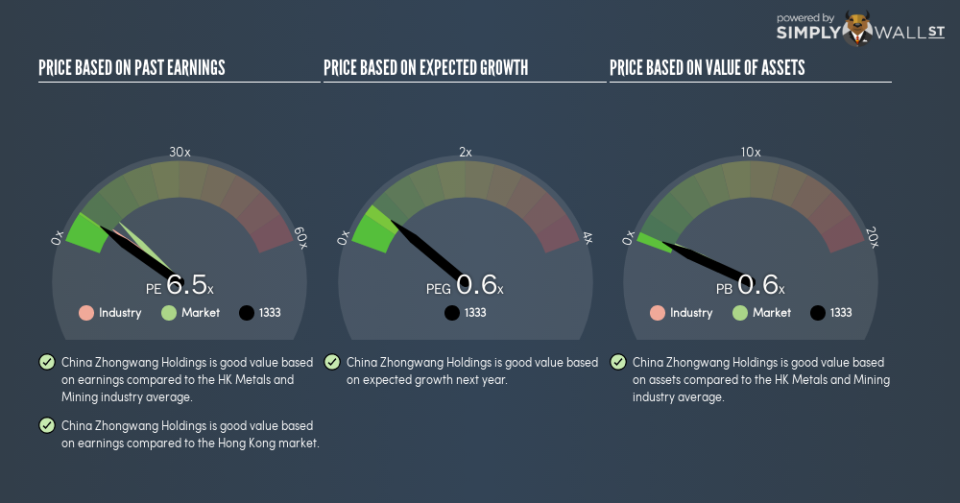
This article is for investors who would like to improve their understanding of price to earnings ratios (P/E ratios). We’ll show how you can use China Zhongwang Holdings Limited’s (HKG:1333) P/E ratio to inform your assessment of the investment opportunity. Based on the last twelve months, China Zhongwang Holdings’s P/E ratio is 6.54. In other words, at today’s prices, investors are paying HK$6.54 for every HK$1 in prior year profit.
See our latest analysis for China Zhongwang Holdings
How Do You Calculate China Zhongwang Holdings’s P/E Ratio?
The formula for P/E is:
Price to Earnings Ratio = Share Price (in reporting currency) ÷ Earnings per Share (EPS)
Or for China Zhongwang Holdings:
P/E of 6.54 = CN¥3.27 (Note: this is the share price in the reporting currency, namely, CNY ) ÷ CN¥0.50 (Based on the trailing twelve months to September 2018.)
Is A High P/E Ratio Good?
A higher P/E ratio implies that investors pay a higher price for the earning power of the business. That isn’t a good or a bad thing on its own, but a high P/E means that buyers have a higher opinion of the business’s prospects, relative to stocks with a lower P/E.
How Growth Rates Impact P/E Ratios
Earnings growth rates have a big influence on P/E ratios. That’s because companies that grow earnings per share quickly will rapidly increase the ‘E’ in the equation. That means unless the share price increases, the P/E will reduce in a few years. So while a stock may look expensive based on past earnings, it could be cheap based on future earnings.
China Zhongwang Holdings increased earnings per share by a whopping 36% last year. And its annual EPS growth rate over 5 years is 5.6%. I’d therefore be a little surprised if its P/E ratio was not relatively high.
How Does China Zhongwang Holdings’s P/E Ratio Compare To Its Peers?
The P/E ratio indicates whether the market has higher or lower expectations of a company. We can see in the image below that the average P/E (7.8) for companies in the metals and mining industry is higher than China Zhongwang Holdings’s P/E.
China Zhongwang Holdings’s P/E tells us that market participants think it will not fare as well as its peers in the same industry. Since the market seems unimpressed with China Zhongwang Holdings, it’s quite possible it could surprise on the upside. You should delve deeper. I like to check if company insiders have been buying or selling.
Remember: P/E Ratios Don’t Consider The Balance Sheet
It’s important to note that the P/E ratio considers the market capitalization, not the enterprise value. Thus, the metric does not reflect cash or debt held by the company. Hypothetically, a company could reduce its future P/E ratio by spending its cash (or taking on debt) to achieve higher earnings.
Such expenditure might be good or bad, in the long term, but the point here is that the balance sheet is not reflected by this ratio.
How Does China Zhongwang Holdings’s Debt Impact Its P/E Ratio?
Net debt totals a substantial 185% of China Zhongwang Holdings’s market cap. This level of debt justifies a relatively low P/E, so remain cognizant of the debt, if you’re comparing it to other stocks.
The Bottom Line On China Zhongwang Holdings’s P/E Ratio
China Zhongwang Holdings trades on a P/E ratio of 6.5, which is below the HK market average of 10.8. While the EPS growth last year was strong, the significant debt levels reduce the number of options available to management. If the company can continue to grow earnings, then the current P/E may be unjustifiably low.
When the market is wrong about a stock, it gives savvy investors an opportunity. If the reality for a company is not as bad as the P/E ratio indicates, then the share price should increase as the market realizes this. So this free report on the analyst consensus forecasts could help you make a master move on this stock.
You might be able to find a better buy than China Zhongwang Holdings. If you want a selection of possible winners, check out this free list of interesting companies that trade on a P/E below 20 (but have proven they can grow earnings).
To help readers see past the short term volatility of the financial market, we aim to bring you a long-term focused research analysis purely driven by fundamental data. Note that our analysis does not factor in the latest price-sensitive company announcements.
The author is an independent contributor and at the time of publication had no position in the stocks mentioned. For errors that warrant correction please contact the editor at editorial-team@simplywallst.com.
