CIBT Education Group Inc (TSE:MBA): Does -126.28% Earnings Drop In A Year Reflect The Long-Term Trend?

After looking at CIBT Education Group Inc’s (TSX:MBA) latest earnings announcement (30 November 2017), I found it useful to revisit the company’s performance in the past couple of years and assess this against the most recent figures. As a long term investor, I pay close attention to earnings trend, rather than the figures published at one point in time. I also compare against an industry benchmark to check whether CIBT Education Group’s performance has been impacted by industry movements. In this article I briefly touch on my key findings. View our latest analysis for CIBT Education Group
Was MBA’s recent earnings decline indicative of a tough track record?
To account for any quarterly or half-yearly updates, I use data from the most recent 12 months, which annualizes the most recent half-year data, or in some cases, the latest annual report is already the most recent financial year data. This technique enables me to assess different companies on a similar basis, using new information. For CIBT Education Group, its most recent bottom-line (trailing twelve month) is -CA$2.26M, which, in comparison to last year’s level, has turned from positive to negative. Given that these figures are fairly myopic, I’ve calculated an annualized five-year figure for MBA’s net income, which stands at -CA$1.13M. This doesn’t seem to paint a better picture, as earnings seem to have consistently been getting more and more negative over time.
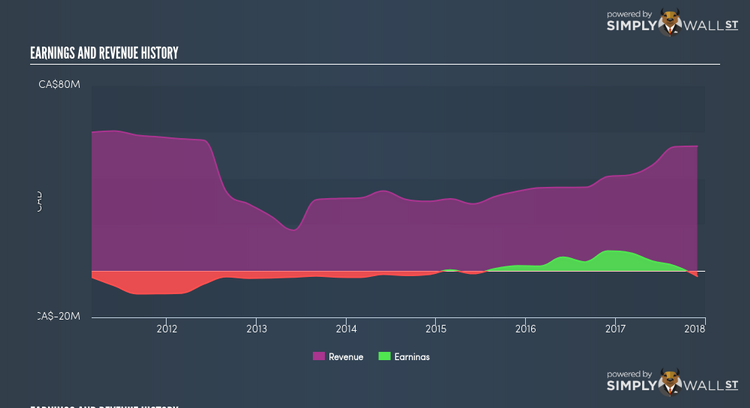
We can further evaluate CIBT Education Group’s loss by looking at what the industry has been experiencing over the past few years. Each year, for the past half a decade CIBT Education Group has seen an annual decline in revenue of -3.52%, on average. This adverse movement is a driver of the company’s inability to reach breakeven. Has the entire industry experienced this headwind? Eyeballing growth from a sector-level, the Canadian consumer services industry has been growing, albeit, at a muted single-digit rate of 2.19% over the prior twelve months, and a substantial 11.27% over the past five. This means that any recent headwind the industry is experiencing, it’s hitting CIBT Education Group harder than its peers.
What does this mean?
Though CIBT Education Group’s past data is helpful, it is only one aspect of my investment thesis. Companies that incur net loss is always hard to predict what will happen in the future and when. The most useful step is to examine company-specific issues CIBT Education Group may be facing and whether management guidance has regularly been met in the past. You should continue to research CIBT Education Group to get a better picture of the stock by looking at:
1. Future Outlook: What are well-informed industry analysts predicting for MBA’s future growth? Take a look at our free research report of analyst consensus for MBA’s outlook.
2. Financial Health: Is MBA’s operations financially sustainable? Balance sheets can be hard to analyze, which is why we’ve done it for you. Check out our financial health checks here.
3. Other High-Performing Stocks: Are there other stocks that provide better prospects with proven track records? Explore our free list of these great stocks here.
NB: Figures in this article are calculated using data from the trailing twelve months from 30 November 2017. This may not be consistent with full year annual report figures.
To help readers see pass the short term volatility of the financial market, we aim to bring you a long-term focused research analysis purely driven by fundamental data. Note that our analysis does not factor in the latest price sensitive company announcements.
The author is an independent contributor and at the time of publication had no position in the stocks mentioned.
