Cincinnati Financial (CINF) Q2 Earnings Top, Premiums Rise Y/Y
Cincinnati Financial Corporation CINF reported second-quarter 2023 operating income of $1.21 per share, which surpassed the Zacks Consensus Estimate by 68%. The bottom line doubled year over year.
The results benefited from higher premiums, net investment income and improved combined ratio, partly offset by escalating costs.
Cincinnati Financial Corporation Price, Consensus and EPS Surprise
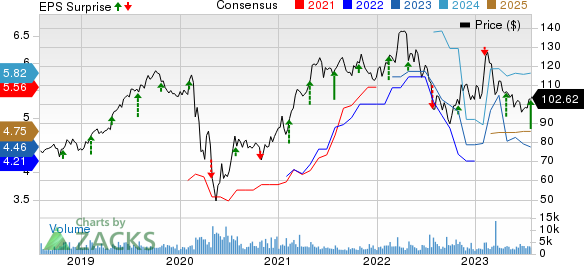
Cincinnati Financial Corporation price-consensus-eps-surprise-chart | Cincinnati Financial Corporation Quote
Operational Update
Total operating revenues in the quarter under review were $2.1 billion, which improved 9.9% year over year. This improvement was driven by higher earned premiums, investment income and other revenues. Also, the top line missed the consensus mark by 0.7%.
Net written premiums climbed 9% year over year to $2.1 billion and matched our estimate. It was driven by premium growth initiatives, price increases and a higher level of insured exposures as well as contribution to growth from Cincinnati Re and Cincinnati Global.
Investment income, net of expenses increased 13% year over year to $220 million and beat our estimate of $209.6 million. It was driven by an increase in interest income from fixed-maturity securities and decrease in equity portfolio dividends. The Zacks Consensus Estimate was pegged at $213 million.
Total benefits and expenses of Cincinnati Financial increased 3.5% year over year to $1.9 billion, primarily due to higher insurance losses and contract holders' benefits, underwriting, acquisition and insurance expenses and other operating expenses. Our estimate was $2.1 billion.
In its property & casualty (P&C) insurance business, CINF witnessed an underwriting income of $47 million against an underwriting loss of $52 million in the year-earlier period. Our estimate was pegged at a loss of $67.4 million.
The combined ratio — a measure of underwriting profitability — improved 560 basis points (bps) year over year to 97.6. Our estimate was pinned at 103.7. The Zacks Consensus Estimate was pegged at 101.
Quarterly Segment Update
Commercial Lines Insurance: Total revenues of $1 billion increased 7% year over year, which matched our estimate as well as the Zacks Consensus Estimate. This upside was primarily driven by 7% premiums earned.
Underwriting income was $33 million against underwriting loss of $62 million in the year-earlier period. The combined ratio improved 940 bps year over year to 96.9. Our estimate was pegged at 102.
Personal Lines Insurance: Total revenues of $494 million increased 19% year over year on account of a 19% rise in premiums earned. Our estimate was $469 million, while the Zacks Consensus Estimate was pegged at $478 million.
Underwriting loss was $36 million, which was narrower than the underwriting loss of $49 million in the year-earlier period. The combined ratio improved 450 bps year over year to 107.6. Our estimate was 103.6, while the Zacks Consensus Estimate was pegged at 106.
Excess and Surplus Lines Insurance: Total revenues of $133 million grew 7% year over year, aided by 6% higher earned premiums. Our estimate was $131 million, while the Zacks Consensus Estimate was pegged at $135 million.
Underwriting profit decreased 42% year over year to $11 million. Our estimate was pinned at $5.4 million. The combined ratio deteriorated 710 bps year over year to 92.2. Our estimate was 95.9.
Life Insurance: Total revenues were $127 million, up 7% year over year, driven by 5% higher earned premiums and 10% higher investment income, net of expenses. The Zacks Consensus Estimate was pegged at $115 million. Our estimate was $81.6 million. Total benefits and expenses decreased 4% year over year to $100 million due to lower contract holders’ benefits incurred.
Financial Update
As of Jun 30, 2023, Cincinnati Financial had total assets worth $31.3 billion, up 5.4% from the level at 2022 end.
Total debt was $814 million as of Jun 30, 2023, down 2.9% from the 2022-end level. The company’s debt-to-capital ratio was 6.9% as of Jun 30, 2023, which improved 50 bps from the end of 2022.
As of Jun 30, 2023, CINF’s book value per share was $70.33, up 4.6% from 2022 end.
Zacks Rank
Cincinnati Financial currently carries a Zacks Rank #3 (Hold). You can see the complete list of today’s Zacks #1 Rank (Strong Buy) stocks here.
Performance of Some Other P&C Insurers
The Travelers Companies TRV reported second-quarter 2023 core income of 6 cents per share, which missed the Zacks Consensus Estimate of $2.27. The bottom line decreased 97.7% year over year. Travelers’ total revenues increased 9.8% from the year-ago quarter to $10.1 billion, primarily driven by higher premiums. The top-line figure was almost in line with the Zacks Consensus Estimate.
Net written premiums increased 14% year over year to a record $10.3 billion, driven by strong growth across all three segments. The figure was higher than our estimate of $9.1 billion.
Travelers witnessed an underwriting gain of $781 million, up 38% year over year, driven by record net earned premiums of $9.2 billion and a consolidated underlying combined ratio, which improved 170 basis points. The combined ratio deteriorated 820 bps year over year to 106.5.
W.R. Berkley Corporation’s WRB second-quarter 2023 operating income of $1.14 per share beat the Zacks Consensus Estimate by 6.5%. The bottom line increased 1.8% year over year. Operating revenues came in at $2.9 billion, down 57.4% year over year. The top line missed the consensus estimate by 1.2%.
W.R. Berkley’s net premiums written were a record $2.8 billion, up 8.7% year over year, as market conditions remained favorable for most lines of business. Our estimate for the same was $2.7 billion. Catastrophe losses totaled $53.5 million in the quarter. The consolidated combined ratio (a measure of underwriting profitability) deteriorated 100 basis points to 89.6, which is in line with the Zacks Consensus Estimate. Our estimate for the combined ratio was 91.3.
Arch Capital Group Ltd. ACGL reported second-quarter 2023 operating income of $1.92 per share, beating the Zacks Consensus Estimate by 16.4%. The bottom line increased 43.3% year over year. Gross premiums written improved 25.2% year over year to $4.8 billion. Net premiums written climbed 27.7% year over year to $3.4 billion on higher premiums written across its Insurance and Reinsurance segments and beat our estimate of $3.1 billion.
Net investment income increased 128.3% year over year to $242 million and beat our estimate of $115.3 million. The Zacks Consensus Estimate was pegged at $185 million. Operating revenues of $3.2 billion rose 32.6% year over year, driven by higher net premiums earned and net investment income. It beat the Zacks Consensus Estimate by 2.3%.
Pre-tax current accident year catastrophic losses, net of reinsurance and reinstatement premiums were $119 million. Arch Capital’s underwriting income increased 13.1% year over year to $606 million. Our estimate was pegged at $686.8 million.
Want the latest recommendations from Zacks Investment Research? Today, you can download 7 Best Stocks for the Next 30 Days. Click to get this free report
The Travelers Companies, Inc. (TRV) : Free Stock Analysis Report
W.R. Berkley Corporation (WRB) : Free Stock Analysis Report
Cincinnati Financial Corporation (CINF) : Free Stock Analysis Report
Arch Capital Group Ltd. (ACGL) : Free Stock Analysis Report
