Has Cincinnati Financial Corporation's (NASDAQ:CINF) Impressive Stock Performance Got Anything to Do With Its Fundamentals?
Cincinnati Financial's (NASDAQ:CINF) stock is up by a considerable 15% over the past month. As most would know, fundamentals are what usually guide market price movements over the long-term, so we decided to look at the company's key financial indicators today to determine if they have any role to play in the recent price movement. In this article, we decided to focus on Cincinnati Financial's ROE.
Return on equity or ROE is an important factor to be considered by a shareholder because it tells them how effectively their capital is being reinvested. In simpler terms, it measures the profitability of a company in relation to shareholder's equity.
View our latest analysis for Cincinnati Financial
How Do You Calculate Return On Equity?
Return on equity can be calculated by using the formula:
Return on Equity = Net Profit (from continuing operations) ÷ Shareholders' Equity
So, based on the above formula, the ROE for Cincinnati Financial is:
12% = US$1.4b ÷ US$11b (Based on the trailing twelve months to June 2023).
The 'return' refers to a company's earnings over the last year. That means that for every $1 worth of shareholders' equity, the company generated $0.12 in profit.
What Is The Relationship Between ROE And Earnings Growth?
So far, we've learned that ROE is a measure of a company's profitability. Depending on how much of these profits the company reinvests or "retains", and how effectively it does so, we are then able to assess a company’s earnings growth potential. Generally speaking, other things being equal, firms with a high return on equity and profit retention, have a higher growth rate than firms that don’t share these attributes.
Cincinnati Financial's Earnings Growth And 12% ROE
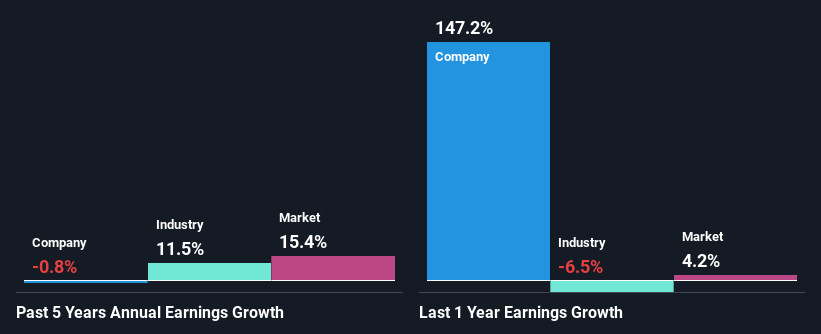
To start with, Cincinnati Financial's ROE looks acceptable. Further, the company's ROE is similar to the industry average of 10%. Despite this, Cincinnati Financial's five year net income growth was quite flat over the past five years. We reckon that there could be some other factors at play here that's limiting the company's growth. These include low earnings retention or poor allocation of capital.
We then compared Cincinnati Financial's net income growth with the industry and found that the average industry growth rate was 11% in the same 5-year period.
Earnings growth is an important metric to consider when valuing a stock. It’s important for an investor to know whether the market has priced in the company's expected earnings growth (or decline). Doing so will help them establish if the stock's future looks promising or ominous. Is Cincinnati Financial fairly valued compared to other companies? These 3 valuation measures might help you decide.
Is Cincinnati Financial Efficiently Re-investing Its Profits?
Cincinnati Financial has a low three-year median payout ratio of 20% (or a retention ratio of 80%) but the negligible earnings growth number doesn't reflect this as high growth usually follows high profit retention.
Moreover, Cincinnati Financial has been paying dividends for at least ten years or more suggesting that management must have perceived that the shareholders prefer dividends over earnings growth.
Summary
Overall, we feel that Cincinnati Financial certainly does have some positive factors to consider. Although, we are disappointed to see a lack of growth in earnings even in spite of a high ROE and and a high reinvestment rate. We believe that there might be some outside factors that could be having a negative impact on the business. Additionally, the latest industry analyst forecasts show that analysts expect the company's earnings to continue to shrink in the future. To know more about the latest analysts predictions for the company, check out this visualization of analyst forecasts for the company.
Have feedback on this article? Concerned about the content? Get in touch with us directly. Alternatively, email editorial-team (at) simplywallst.com.
This article by Simply Wall St is general in nature. We provide commentary based on historical data and analyst forecasts only using an unbiased methodology and our articles are not intended to be financial advice. It does not constitute a recommendation to buy or sell any stock, and does not take account of your objectives, or your financial situation. We aim to bring you long-term focused analysis driven by fundamental data. Note that our analysis may not factor in the latest price-sensitive company announcements or qualitative material. Simply Wall St has no position in any stocks mentioned.
Join A Paid User Research Session
You’ll receive a US$30 Amazon Gift card for 1 hour of your time while helping us build better investing tools for the individual investors like yourself. Sign up here
