Cleveland-Cliffs (CLF) Just Reclaimed the 50-Day Moving Average
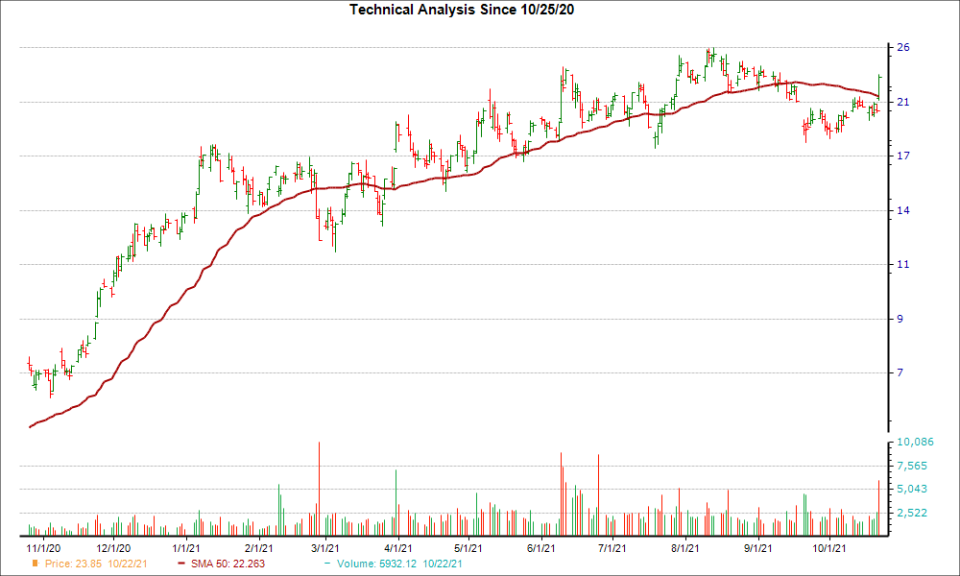
From a technical perspective, Cleveland-Cliffs (CLF) is looking like an interesting pick, as it just reached a key level of support. CLF recently overtook the 50-day moving average, and this suggests a short-term bullish trend.
The 50-day simple moving average, which is one of three major moving averages, is widely used by traders and analysts to establish support and resistance levels for a range of securities. Because it's the first sign of an up or down trend, the 50-day is considered to be more important.
CLF could be on the verge of another rally after moving 16.3% higher over the last four weeks. Plus, the company is currently a Zacks Rank #2 (Buy) stock.
Looking at CLF's earnings estimate revisions, investors will be even more convinced of the bullish uptrend. There have been 3 higher compared to none lower for the current fiscal year, and the consensus estimate has moved up as well.
Given this move in earnings estimate revisions and the positive technical factor, investors may want to keep their eye on CLF for more gains in the near future.
Want the latest recommendations from Zacks Investment Research? Today, you can download 7 Best Stocks for the Next 30 Days. Click to get this free report
ClevelandCliffs Inc. (CLF) : Free Stock Analysis Report
To read this article on Zacks.com click here.
Zacks Investment Research
