A Close Look At Activision Blizzard, Inc.’s (NASDAQ:ATVI) 12% ROCE

Today we'll evaluate Activision Blizzard, Inc. (NASDAQ:ATVI) to determine whether it could have potential as an investment idea. Specifically, we're going to calculate its Return On Capital Employed (ROCE), in the hopes of getting some insight into the business.
Firstly, we'll go over how we calculate ROCE. Second, we'll look at its ROCE compared to similar companies. Finally, we'll look at how its current liabilities affect its ROCE.
Return On Capital Employed (ROCE): What is it?
ROCE is a measure of a company's yearly pre-tax profit (its return), relative to the capital employed in the business. Generally speaking a higher ROCE is better. In brief, it is a useful tool, but it is not without drawbacks. Renowned investment researcher Michael Mauboussin has suggested that a high ROCE can indicate that 'one dollar invested in the company generates value of more than one dollar'.
How Do You Calculate Return On Capital Employed?
The formula for calculating the return on capital employed is:
Return on Capital Employed = Earnings Before Interest and Tax (EBIT) ÷ (Total Assets - Current Liabilities)
Or for Activision Blizzard:
0.12 = US$2.0b ÷ (US$18b - US$1.8b) (Based on the trailing twelve months to September 2019.)
So, Activision Blizzard has an ROCE of 12%.
See our latest analysis for Activision Blizzard
Is Activision Blizzard's ROCE Good?
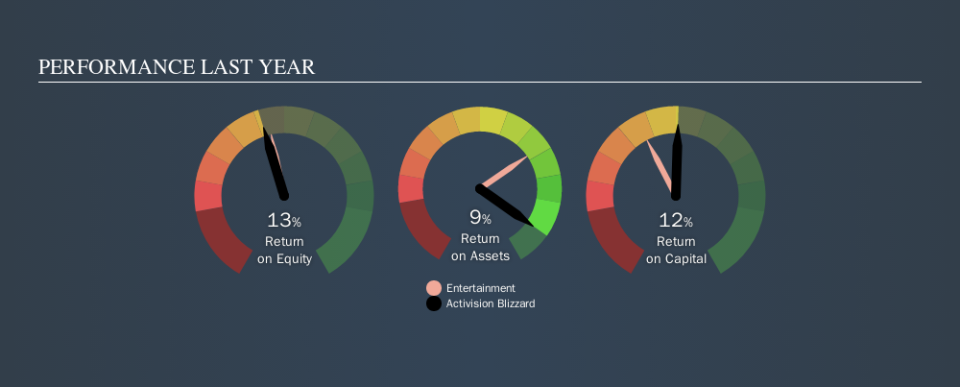
ROCE can be useful when making comparisons, such as between similar companies. In our analysis, Activision Blizzard's ROCE is meaningfully higher than the 9.6% average in the Entertainment industry. We would consider this a positive, as it suggests it is using capital more effectively than other similar companies. Independently of how Activision Blizzard compares to its industry, its ROCE in absolute terms appears decent, and the company may be worthy of closer investigation.
Our data shows that Activision Blizzard currently has an ROCE of 12%, compared to its ROCE of 8.7% 3 years ago. This makes us think the business might be improving. You can see in the image below how Activision Blizzard's ROCE compares to its industry. Click to see more on past growth.
It is important to remember that ROCE shows past performance, and is not necessarily predictive. Companies in cyclical industries can be difficult to understand using ROCE, as returns typically look high during boom times, and low during busts. ROCE is, after all, simply a snap shot of a single year. Since the future is so important for investors, you should check out our free report on analyst forecasts for Activision Blizzard.
Activision Blizzard's Current Liabilities And Their Impact On Its ROCE
Liabilities, such as supplier bills and bank overdrafts, are referred to as current liabilities if they need to be paid within 12 months. The ROCE equation subtracts current liabilities from capital employed, so a company with a lot of current liabilities appears to have less capital employed, and a higher ROCE than otherwise. To counter this, investors can check if a company has high current liabilities relative to total assets.
Activision Blizzard has total liabilities of US$1.8b and total assets of US$18b. As a result, its current liabilities are equal to approximately 9.8% of its total assets. With low current liabilities, Activision Blizzard's decent ROCE looks that much more respectable.
Our Take On Activision Blizzard's ROCE
If Activision Blizzard can continue reinvesting in its business, it could be an attractive prospect. There might be better investments than Activision Blizzard out there, but you will have to work hard to find them . These promising businesses with rapidly growing earnings might be right up your alley.
If you are like me, then you will not want to miss this free list of growing companies that insiders are buying.
We aim to bring you long-term focused research analysis driven by fundamental data. Note that our analysis may not factor in the latest price-sensitive company announcements or qualitative material.
If you spot an error that warrants correction, please contact the editor at editorial-team@simplywallst.com. This article by Simply Wall St is general in nature. It does not constitute a recommendation to buy or sell any stock, and does not take account of your objectives, or your financial situation. Simply Wall St has no position in the stocks mentioned. Thank you for reading.
