A Close Look At Caterpillar Inc.’s (NYSE:CAT) 16% ROCE

Today we'll evaluate Caterpillar Inc. (NYSE:CAT) to determine whether it could have potential as an investment idea. Specifically, we'll consider its Return On Capital Employed (ROCE), since that will give us an insight into how efficiently the business can generate profits from the capital it requires.
First, we'll go over how we calculate ROCE. Then we'll compare its ROCE to similar companies. Last but not least, we'll look at what impact its current liabilities have on its ROCE.
Return On Capital Employed (ROCE): What is it?
ROCE measures the amount of pre-tax profits a company can generate from the capital employed in its business. All else being equal, a better business will have a higher ROCE. In brief, it is a useful tool, but it is not without drawbacks. Author Edwin Whiting says to be careful when comparing the ROCE of different businesses, since 'No two businesses are exactly alike.
How Do You Calculate Return On Capital Employed?
The formula for calculating the return on capital employed is:
Return on Capital Employed = Earnings Before Interest and Tax (EBIT) ÷ (Total Assets - Current Liabilities)
Or for Caterpillar:
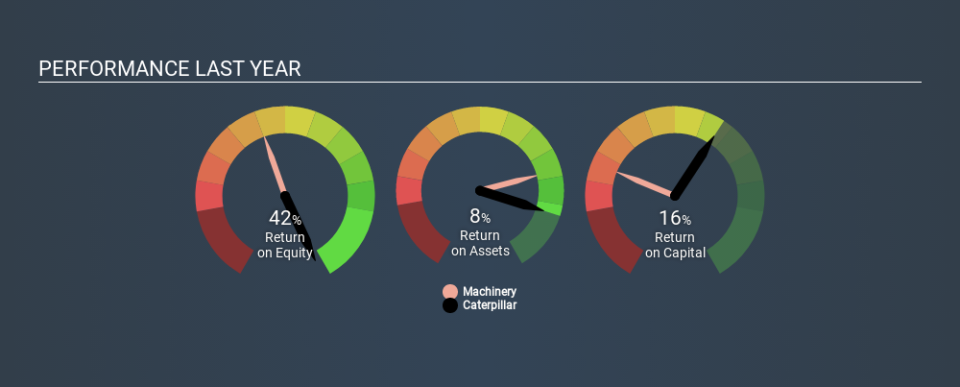
0.16 = US$8.3b ÷ (US$78b - US$27b) (Based on the trailing twelve months to December 2019.)
Therefore, Caterpillar has an ROCE of 16%.
View our latest analysis for Caterpillar
Is Caterpillar's ROCE Good?
When making comparisons between similar businesses, investors may find ROCE useful. Caterpillar's ROCE appears to be substantially greater than the 11% average in the Machinery industry. I think that's good to see, since it implies the company is better than other companies at making the most of its capital. Independently of how Caterpillar compares to its industry, its ROCE in absolute terms appears decent, and the company may be worthy of closer investigation.
In our analysis, Caterpillar's ROCE appears to be 16%, compared to 3 years ago, when its ROCE was 3.9%. This makes us think the business might be improving. You can click on the image below to see (in greater detail) how Caterpillar's past growth compares to other companies.
It is important to remember that ROCE shows past performance, and is not necessarily predictive. Companies in cyclical industries can be difficult to understand using ROCE, as returns typically look high during boom times, and low during busts. This is because ROCE only looks at one year, instead of considering returns across a whole cycle. Future performance is what matters, and you can see analyst predictions in our free report on analyst forecasts for the company.
Caterpillar's Current Liabilities And Their Impact On Its ROCE
Short term (or current) liabilities, are things like supplier invoices, overdrafts, or tax bills that need to be paid within 12 months. Due to the way the ROCE equation works, having large bills due in the near term can make it look as though a company has less capital employed, and thus a higher ROCE than usual. To counter this, investors can check if a company has high current liabilities relative to total assets.
Caterpillar has current liabilities of US$27b and total assets of US$78b. Therefore its current liabilities are equivalent to approximately 34% of its total assets. Caterpillar has a middling amount of current liabilities, increasing its ROCE somewhat.
The Bottom Line On Caterpillar's ROCE
While its ROCE looks good, it's worth remembering that the current liabilities are making the business look better. Caterpillar looks strong on this analysis, but there are plenty of other companies that could be a good opportunity . Here is a free list of companies growing earnings rapidly.
If you like to buy stocks alongside management, then you might just love this free list of companies. (Hint: insiders have been buying them).
If you spot an error that warrants correction, please contact the editor at editorial-team@simplywallst.com. This article by Simply Wall St is general in nature. It does not constitute a recommendation to buy or sell any stock, and does not take account of your objectives, or your financial situation. Simply Wall St has no position in the stocks mentioned.
We aim to bring you long-term focused research analysis driven by fundamental data. Note that our analysis may not factor in the latest price-sensitive company announcements or qualitative material. Thank you for reading.
