CME Group Inc's Dividend Analysis
Understanding CME Group Inc's Upcoming Dividend Payment
CME Group Inc (NASDAQ:CME) recently announced a dividend of $1.15 per share, payable on 2024-03-26, with the ex-dividend date set for 2024-03-07. As investors look forward to this upcoming payment, the spotlight also shines on the company's dividend history, yield, and growth rates. Using the data from GuruFocus, let's look into CME Group Inc's dividend performance and assess its sustainability.
What Does CME Group Inc Do?
This Powerful Chart Made Peter Lynch 29% A Year For 13 Years
How to calculate the intrinsic value of a stock?
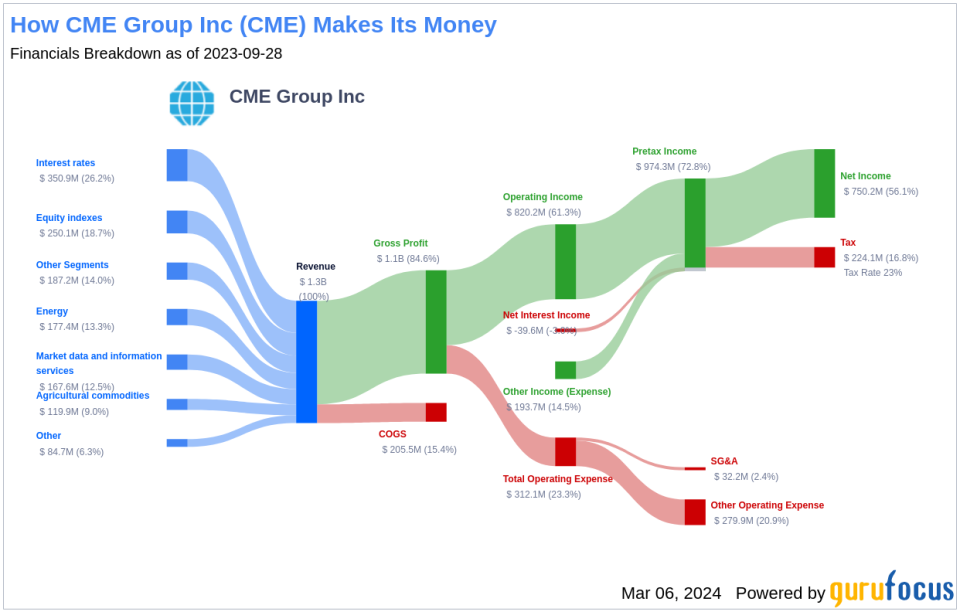
Based in Chicago, CME Group operates exchanges giving investors, suppliers, and businesses the ability to trade futures and derivatives based on interest rates, equity indexes, foreign currencies, energy, metals, and commodities. The CME was founded in 1898 and in 2002 completed its initial public offering. Since then, CME Group has consolidated parts of the industry by merging with crosstown rival, CBOT Holdings in 2007 before acquiring Nymex Holdings in 2008 and NEX in 2018. In addition, the company has a 27% stake in S&P Dow Jones Indices, making the Chicago Mercantile Exchange the exclusive venue to trade and clear S&P futures contracts. Through CME's acquisition of NEX in 2018 it has also expanded into cash foreign exchange, fixed income trading, and collateral optimization.
A Glimpse at CME Group Inc's Dividend History
CME Group Inc has maintained a consistent dividend payment record since 2003, with dividends currently being distributed on a quarterly basis. Below is a chart showing annual Dividends Per Share for tracking historical trends.
Breaking Down CME Group Inc's Dividend Yield and Growth
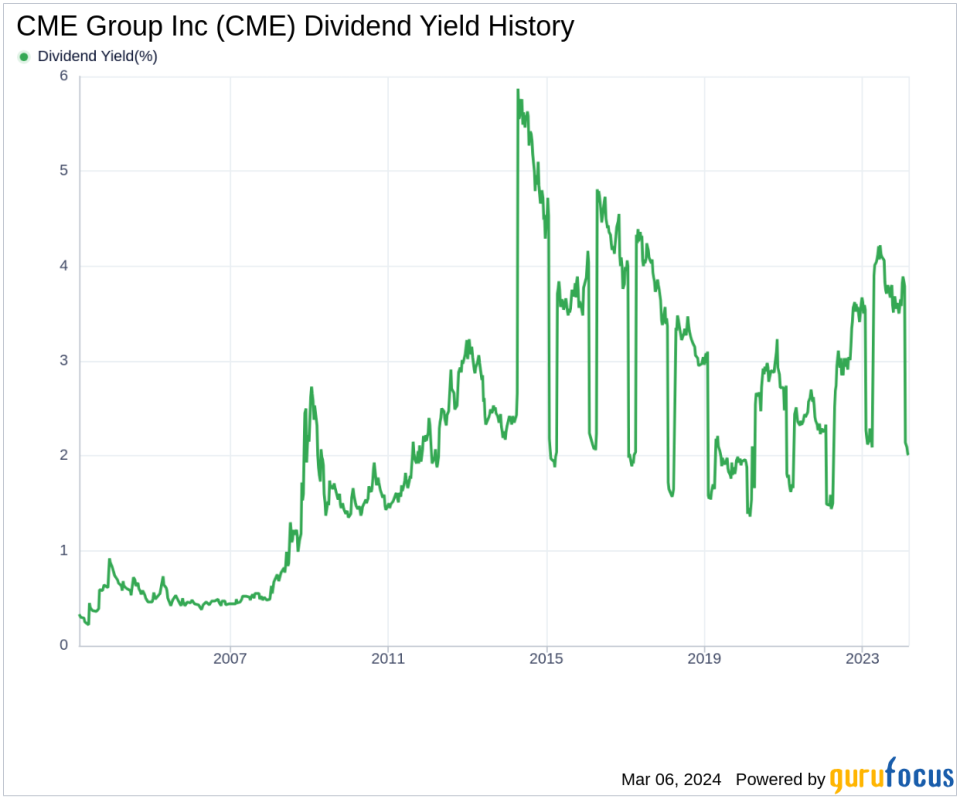
As of today, CME Group Inc currently has a 12-month trailing dividend yield of 3.90% and a 12-month forward dividend yield of 3.92%, suggesting an expectation of increased dividend payments over the next 12 months.
Over the past three years, CME Group Inc's annual dividend growth rate was 17.80%. Extended to a five-year horizon, this rate decreased to 16.10% per year. And over the past decade, CME Group Inc's annual dividends per share growth rate stands at 7.60%.
Based on CME Group Inc's dividend yield and five-year growth rate, the 5-year yield on cost of CME Group Inc stock as of today is approximately 8.23%.
The Sustainability Question: Payout Ratio and Profitability
To assess the sustainability of the dividend, one needs to evaluate the company's payout ratio. The dividend payout ratio provides insights into the portion of earnings the company distributes as dividends. A lower ratio suggests that the company retains a significant part of its earnings, thereby ensuring the availability of funds for future growth and unexpected downturns. As of 2023-12-31, CME Group Inc's dividend payout ratio is 1.49, which may suggest that the company's dividend may not be sustainable.
CME Group Inc's profitability rank, offers an understanding of the company's earnings prowess relative to its peers. GuruFocus ranks CME Group Inc's profitability 8 out of 10 as of 2023-12-31, suggesting good profitability prospects. The company has reported positive net income for each of year over the past decade, further solidifying its high profitability.
Growth Metrics: The Future Outlook
To ensure the sustainability of dividends, a company must have robust growth metrics. CME Group Inc's growth rank of 8 out of 10 suggests that the company's growth trajectory is good relative to its competitors.
Revenue is the lifeblood of any company, and CME Group Inc's revenue per share, combined with the 3-year revenue growth rate, indicates a strong revenue model. CME Group Inc's revenue has increased by approximately 4.40% per year on average, a rate that underperforms approximately 54.05% of global competitors.
The company's 3-year EPS growth rate showcases its capability to grow its earnings, a critical component for sustaining dividends in the long run. During the past three years, CME Group Inc's earnings increased by approximately 19.50% per year on average, a rate that underperforms approximately 37.74% of global competitors.
Lastly, the company's 5-year EBITDA growth rate of 7.90%, which underperforms approximately 57.37% of global competitors, is another consideration for dividend sustainability.
Concluding Insights on CME Group Inc's Dividend Profile
In conclusion, while CME Group Inc's dividend yield and growth rates present an attractive scenario for income-focused investors, the sustainability of these dividends warrants a closer examination of the company's payout ratio, profitability, and growth metrics. Investors should consider these factors in the context of their investment strategy and the broader market environment. With an informed perspective, shareholders can better anticipate the future of their dividend income from CME Group Inc.
GuruFocus Premium users can screen for high-dividend yield stocks using the High Dividend Yield Screener.
This article, generated by GuruFocus, is designed to provide general insights and is not tailored financial advice. Our commentary is rooted in historical data and analyst projections, utilizing an impartial methodology, and is not intended to serve as specific investment guidance. It does not formulate a recommendation to purchase or divest any stock and does not consider individual investment objectives or financial circumstances. Our objective is to deliver long-term, fundamental data-driven analysis. Be aware that our analysis might not incorporate the most recent, price-sensitive company announcements or qualitative information. GuruFocus holds no position in the stocks mentioned herein.
This article first appeared on GuruFocus.
