Cochlear Limited's (ASX:COH) institutional investors lost 4.5% last week but have benefitted from longer-term gains
Key Insights
Institutions' substantial holdings in Cochlear implies that they have significant influence over the company's share price
The top 25 shareholders own 45% of the company
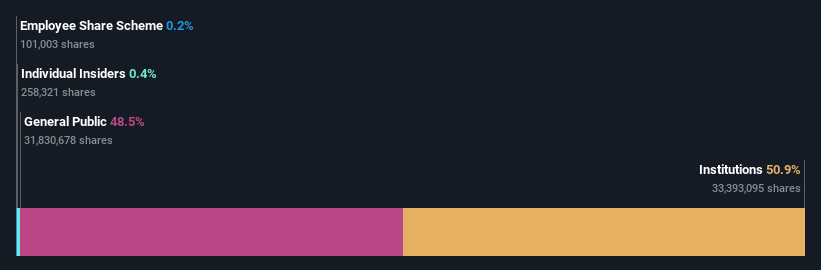
If you want to know who really controls Cochlear Limited (ASX:COH), then you'll have to look at the makeup of its share registry. We can see that institutions own the lion's share in the company with 51% ownership. In other words, the group stands to gain the most (or lose the most) from their investment into the company.
Institutional investors was the group most impacted after the company's market cap fell to AU$16b last week. However, the 29% one-year returns may have helped alleviate their overall losses. They should, however, be mindful of further losses in the future.
In the chart below, we zoom in on the different ownership groups of Cochlear.
Check out our latest analysis for Cochlear
What Does The Institutional Ownership Tell Us About Cochlear?
Many institutions measure their performance against an index that approximates the local market. So they usually pay more attention to companies that are included in major indices.
As you can see, institutional investors have a fair amount of stake in Cochlear. This can indicate that the company has a certain degree of credibility in the investment community. However, it is best to be wary of relying on the supposed validation that comes with institutional investors. They too, get it wrong sometimes. If multiple institutions change their view on a stock at the same time, you could see the share price drop fast. It's therefore worth looking at Cochlear's earnings history below. Of course, the future is what really matters.
Investors should note that institutions actually own more than half the company, so they can collectively wield significant power. We note that hedge funds don't have a meaningful investment in Cochlear. The company's largest shareholder is BlackRock, Inc., with ownership of 6.8%. Meanwhile, the second and third largest shareholders, hold 5.9% and 5.4%, of the shares outstanding, respectively.
On studying our ownership data, we found that 25 of the top shareholders collectively own less than 50% of the share register, implying that no single individual has a majority interest.
While studying institutional ownership for a company can add value to your research, it is also a good practice to research analyst recommendations to get a deeper understand of a stock's expected performance. There are a reasonable number of analysts covering the stock, so it might be useful to find out their aggregate view on the future.
Insider Ownership Of Cochlear
While the precise definition of an insider can be subjective, almost everyone considers board members to be insiders. The company management answer to the board and the latter should represent the interests of shareholders. Notably, sometimes top-level managers are on the board themselves.
I generally consider insider ownership to be a good thing. However, on some occasions it makes it more difficult for other shareholders to hold the board accountable for decisions.
Our data suggests that insiders own under 1% of Cochlear Limited in their own names. Being so large, we would not expect insiders to own a large proportion of the stock. Collectively, they own AU$63m of stock. It is good to see board members owning shares, but it might be worth checking if those insiders have been buying.
General Public Ownership
The general public, who are usually individual investors, hold a 49% stake in Cochlear. This size of ownership, while considerable, may not be enough to change company policy if the decision is not in sync with other large shareholders.
Next Steps:
I find it very interesting to look at who exactly owns a company. But to truly gain insight, we need to consider other information, too.
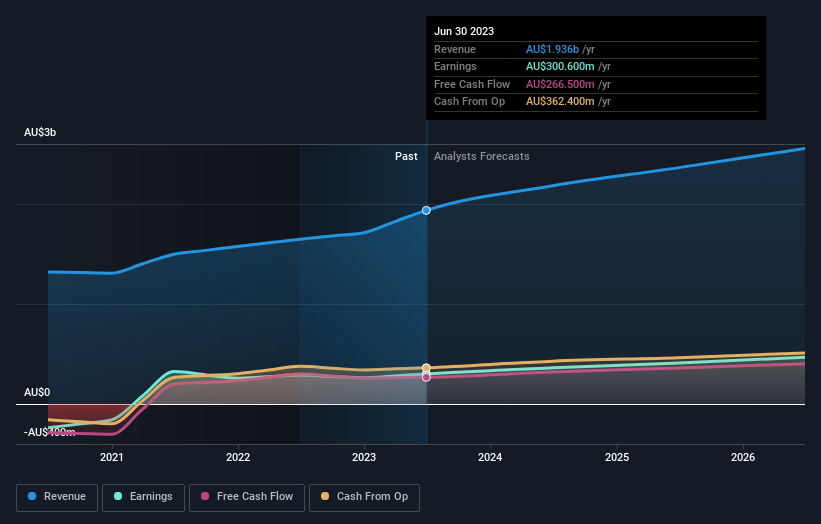
Many find it useful to take an in depth look at how a company has performed in the past. You can access this detailed graph of past earnings, revenue and cash flow.
If you would prefer discover what analysts are predicting in terms of future growth, do not miss this free report on analyst forecasts.
NB: Figures in this article are calculated using data from the last twelve months, which refer to the 12-month period ending on the last date of the month the financial statement is dated. This may not be consistent with full year annual report figures.
Have feedback on this article? Concerned about the content? Get in touch with us directly. Alternatively, email editorial-team (at) simplywallst.com.
This article by Simply Wall St is general in nature. We provide commentary based on historical data and analyst forecasts only using an unbiased methodology and our articles are not intended to be financial advice. It does not constitute a recommendation to buy or sell any stock, and does not take account of your objectives, or your financial situation. We aim to bring you long-term focused analysis driven by fundamental data. Note that our analysis may not factor in the latest price-sensitive company announcements or qualitative material. Simply Wall St has no position in any stocks mentioned.
