Cognizant Technology Solutions Corp: A High-Performing Stock with a GF Score of 93
Cognizant Technology Solutions Corp (NASDAQ:CTSH), a leading player in the software industry, has been making waves in the stock market. As of August 3, 2023, the company's stock price stands at $69.25, reflecting a gain of 5.98% today and a 6.09% increase over the past four weeks. With a market cap of $35.14 billion, Cognizant's impressive performance is further underscored by its high GF Score of 93 out of 100, placing it in the category of stocks with the highest outperformance potential. This article delves into the components of Cognizant's GF Score, providing a comprehensive analysis of its financial strength, profitability, growth, GF Value, and momentum ranks.
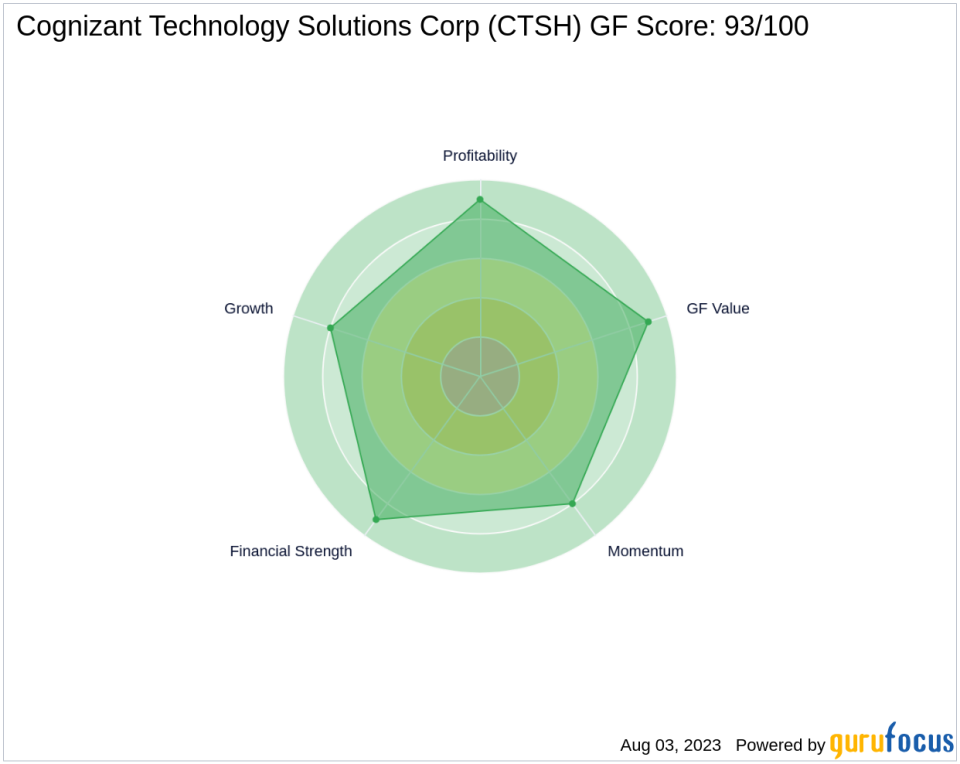
Financial Strength Analysis
Cognizant's Financial Strength rank stands at an impressive 9 out of 10. This rank measures the robustness of a company's financial situation, taking into account factors such as its debt burden, debt to revenue ratio, and Altman Z-Score. Cognizant's high interest coverage of 113.31 and low debt to revenue ratio of 0.08 indicate a minimal debt burden. Furthermore, its Altman Z-Score of 6.50 suggests a low risk of bankruptcy, further bolstering its financial strength.
Profitability Rank Analysis
The company's Profitability Rank is also high at 9 out of 10. This rank assesses a company's profitability and its likelihood of remaining profitable. Cognizant's operating margin of 15.17% and Piotroski F-Score of 6 indicate solid profitability. Despite a slight downtrend in the 5-year average operating margin (-3.20%), the company has consistently been profitable over the past decade. Its Predictability Rank of 3.5 further underscores this consistency.
Growth Rank Analysis
Cognizant's Growth Rank of 8 out of 10 reflects its strong revenue and profitability growth. The company's 5-year revenue growth rate of 8.30% and 3-year revenue growth rate of 7.70% demonstrate a steady increase in revenue. Additionally, its 5-year EBITDA growth rate of 4.90% indicates a consistent growth in its business operations.
GF Value Rank Analysis
The company's GF Value Rank is 9 out of 10, determined by its price-to-GF-Value ratio. This proprietary metric takes into account historical multiples and an adjustment factor based on past returns, growth, and future business performance estimates. Cognizant's high GF Value Rank suggests that it is neither overvalued nor undervalued, but rather fairly valued.
Momentum Rank Analysis
Cognizant's Momentum Rank of 8 out of 10 is determined by its standardized momentum ratio and other momentum indicators. This rank reflects the company's strong price performance, suggesting a positive momentum in its stock price.
Competitor Analysis
When compared to its main competitors in the software industry, Cognizant holds its ground. Fidelity National Information Services Inc (NYSE:FIS) has a GF Score of 63, while Gartner Inc (NYSE:IT) and CDW Corp (NASDAQ:CDW) have GF Scores of 91 and 92, respectively. This comparison further highlights Cognizant's strong performance and potential for outperformance. More details about the competitors can be found here.
Conclusion
In conclusion, Cognizant Technology Solutions Corp's high GF Score of 93 reflects its strong financial strength, profitability, growth, GF Value, and momentum ranks. The company's consistent performance and potential for outperformance make it a compelling choice for investors. As always, investors are advised to conduct their own comprehensive research before making investment decisions.
This article first appeared on GuruFocus.
