Colruyt Group NV's Dividend Analysis
Understanding the Dividend Profile of Colruyt Group NV
Colruyt Group NV (CUYTY) recently announced a dividend of $0.27 per share, payable on 2024-01-08, with the ex-dividend date set for 2023-12-20. As investors look forward to this upcoming payment, the spotlight also shines on the company's dividend history, yield, and growth rates. Using the data from GuruFocus, let's look into Colruyt Group NV's dividend performance and assess its sustainability.
What Does Colruyt Group NV Do?
Warning! GuruFocus has detected 10 Warning Signs with CUYTY.
This Powerful Chart Made Peter Lynch 29% A Year For 13 Years
How to calculate the intrinsic value of a stock?
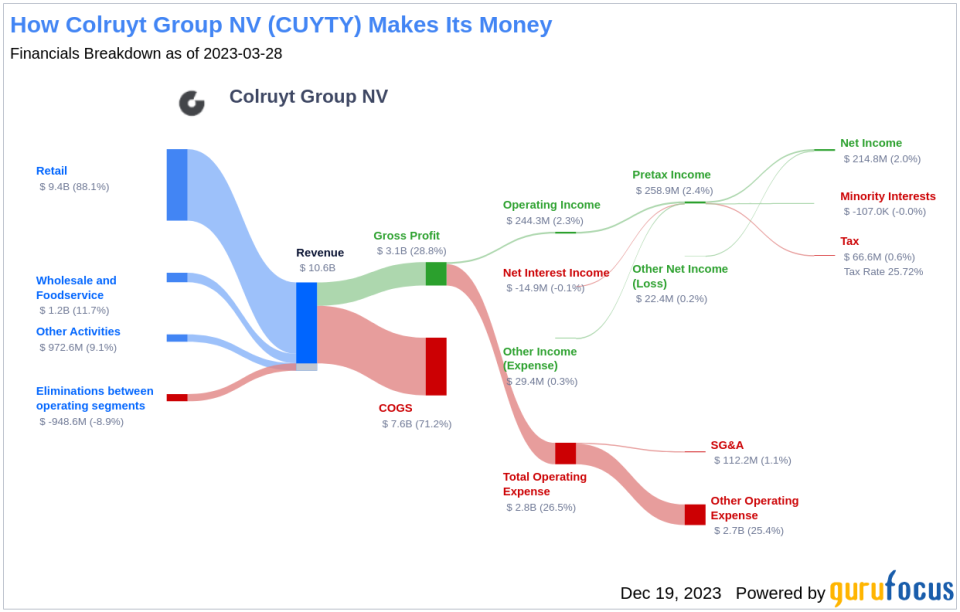
Colruyt Group NV, formerly known as Etablissementen Franz Colruyt NV, is a Belgian-based family-owned food retailer with nearly 30,000 employees and more than 530 stores (460 stores in Belgium and 76 in France) that traces its origins back to 1928. Aside from its flagship Colruyt supermarkets in Belgium and Luxembourg (60% of sales), it generates 16% of sales under separate banners from neighbourhood stores, biosupermarkets, covered markets, and family and seasonal stores. Its food service and wholesale businesses account for a further 18% of sales. Colruyt also owns DATS 24 filling stations, and a green energy business, generating electricity from wind turbines, solar panels, and biomass.
A Glimpse at Colruyt Group NV's Dividend History
Colruyt Group NV has maintained a consistent dividend payment record since 2009, with dividends currently distributed on a bi-annual basis. Below is a chart showing annual Dividends Per Share for tracking historical trends.
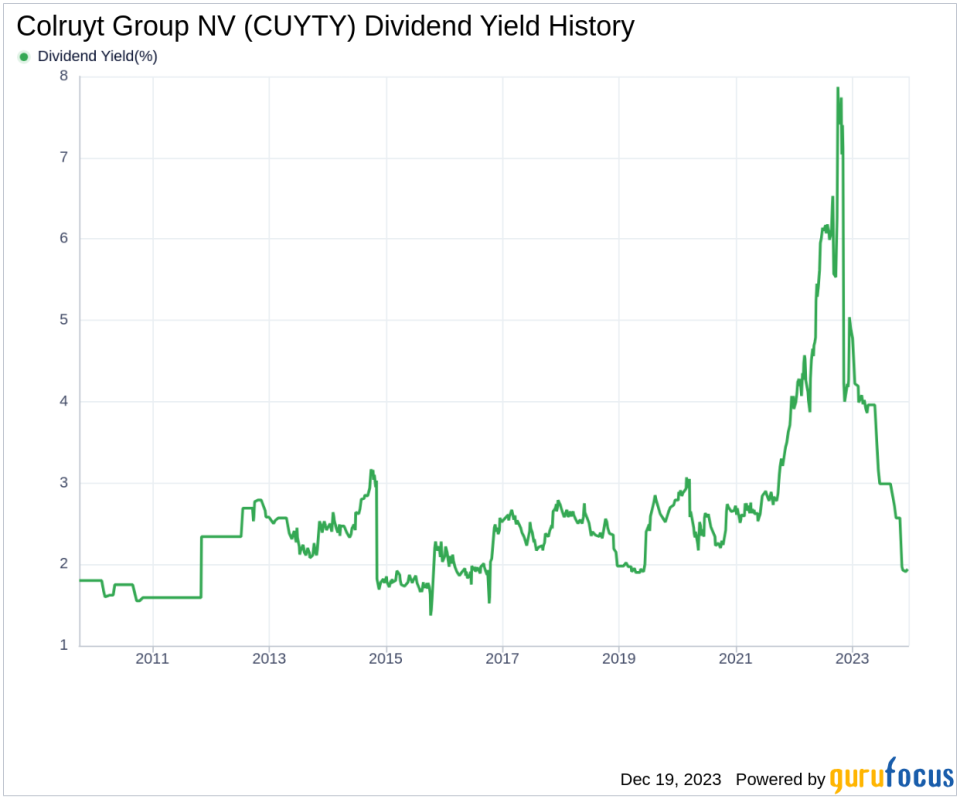
Breaking Down Colruyt Group NV's Dividend Yield and Growth
As of today, Colruyt Group NV currently has a 12-month trailing dividend yield of 1.94% and a 12-month forward dividend yield of 5.02%. This suggests an expectation of increased dividend payments over the next 12 months. Over the past three years, Colruyt Group NV's annual dividend growth rate was -5.70%. Extended to a five-year horizon, this rate increased to 0.70% per year. And over the past decade, Colruyt Group NV's annual dividends per share growth rate stands at 3.50%.
Based on Colruyt Group NV's dividend yield and five-year growth rate, the 5-year yield on cost of Colruyt Group NV stock as of today is approximately 2.01%.
The Sustainability Question: Payout Ratio and Profitability
To assess the sustainability of the dividend, one needs to evaluate the company's payout ratio. The dividend payout ratio provides insights into the portion of earnings the company distributes as dividends. A lower ratio suggests that the company retains a significant part of its earnings, thereby ensuring the availability of funds for future growth and unexpected downturns. As of 2023-03-31, Colruyt Group NV's dividend payout ratio is 0.79, which may suggest that the company's dividend may not be sustainable.
Colruyt Group NV's profitability rank, offers an understanding of the company's earnings prowess relative to its peers. GuruFocus ranks Colruyt Group NV's profitability 7 out of 10 as of 2023-03-31, suggesting good profitability prospects. The company has reported positive net income for each of year over the past decade, further solidifying its high profitability.
Growth Metrics: The Future Outlook
To ensure the sustainability of dividends, a company must have robust growth metrics. Colruyt Group NV's growth rank of 7 out of 10 suggests that the company's growth trajectory is good relative to its competitors. Revenue is the lifeblood of any company, and Colruyt Group NV's revenue per share, combined with the 3-year revenue growth rate, indicates a strong revenue model. Colruyt Group NV's revenue has increased by approximately 3.60% per year on average, a rate that underperforms approximately 55.75% of global competitors.
The company's 3-year EPS growth rate showcases its capability to grow its earnings, a critical component for sustaining dividends in the long run. During the past three years, Colruyt Group NV's earnings decreased by approximately -24.20% per year on average, a rate that underperforms approximately 92.37% of global competitors. Lastly, the company's 5-year EBITDA growth rate of -11.00%, which underperforms approximately 90.23% of global competitors.
Next Steps
In light of Colruyt Group NV's dividend payments, dividend growth rate, payout ratio, profitability, and growth metrics, investors should consider both the strengths and areas of concern before making investment decisions. While the company has a history of consistent dividend payments and a respectable profitability rank, the negative growth rates in earnings and EBITDA raise questions about the long-term sustainability of its dividend payments. Investors seeking to diversify their portfolios with dividend-paying stocks should weigh these factors and monitor the company's performance closely. GuruFocus Premium users can screen for high-dividend yield stocks using the High Dividend Yield Screener.
This article, generated by GuruFocus, is designed to provide general insights and is not tailored financial advice. Our commentary is rooted in historical data and analyst projections, utilizing an impartial methodology, and is not intended to serve as specific investment guidance. It does not formulate a recommendation to purchase or divest any stock and does not consider individual investment objectives or financial circumstances. Our objective is to deliver long-term, fundamental data-driven analysis. Be aware that our analysis might not incorporate the most recent, price-sensitive company announcements or qualitative information. GuruFocus holds no position in the stocks mentioned herein.
This article first appeared on GuruFocus.
