Comerica Inc (CMA): A Deep Dive into Its Performance Potential
Long-established in the Banks industry, Comerica Inc (NYSE:CMA) has enjoyed a stellar reputation. It has recently witnessed a daily gain of 1.92%, juxtaposed with a three-month change of -7.38%. However, fresh insights from the GF Score hint at potential headwinds. Notably, its diminished rankings in financial strength, growth, and valuation suggest that the company might not live up to its historical performance. Join us as we dive deep into these pivotal metrics to unravel the evolving narrative of Comerica Inc.
Understanding the GF Score
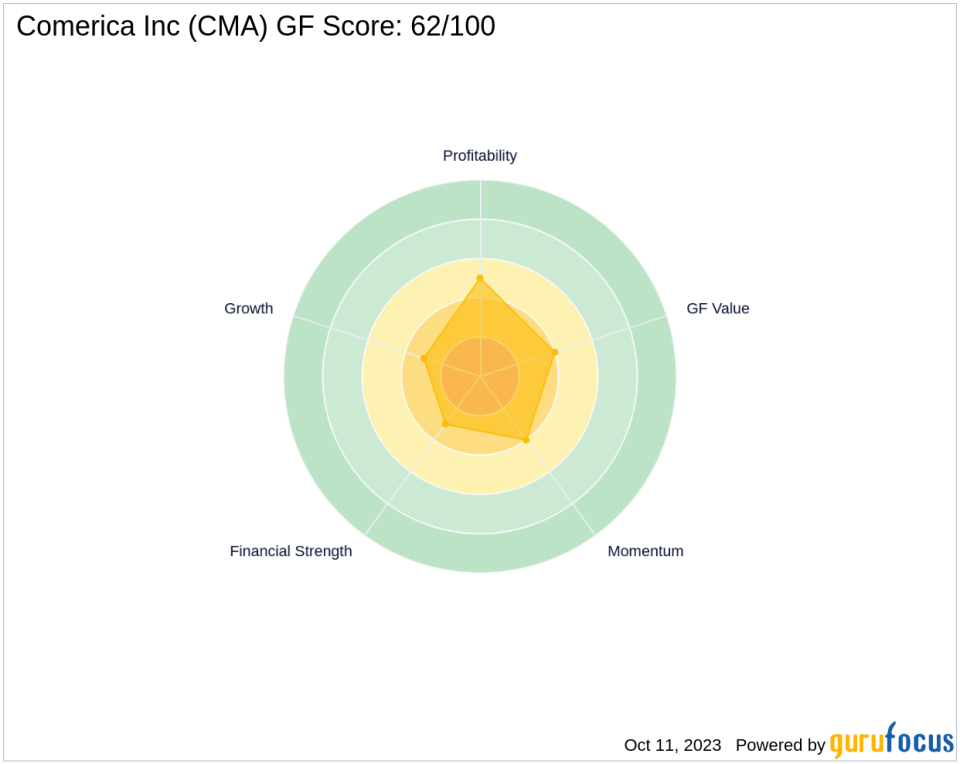
The GF Score is a stock performance ranking system developed by GuruFocus using five aspects of valuation, which has been found to be closely correlated to the long-term performances of stocks by backtesting from 2006 to 2021. The stocks with a higher GF Score generally generate higher returns than those with a lower GF Score. Therefore, when picking stocks, investors should invest in companies with high GF Scores. The GF Score ranges from 0 to 100, with 100 as the highest rank.
Financial strength rank: 3/10
Profitability rank: 5/10
Growth rank: 3/10
GF Value rank: 4/10
Momentum rank: 4/10
Based on the above method, GuruFocus assigned Comerica Inc the GF Score of 62 out of 100, which signals poor future outperformance potential.
Comerica Inc: A Snapshot
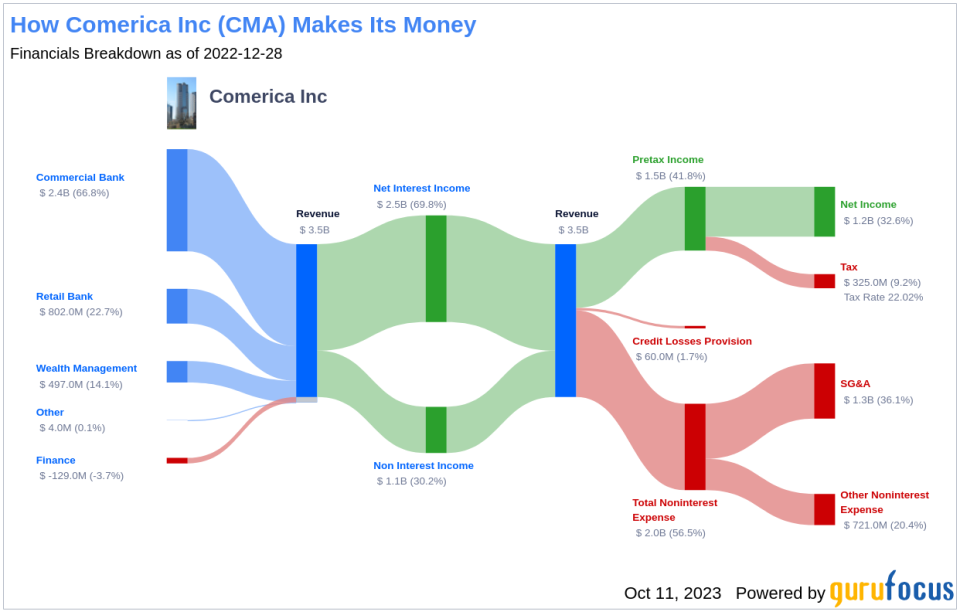
Comerica Inc is a financial services company headquartered in Dallas, primarily focused on relationship-based commercial banking. With a market cap of $5.56 billion and sales of $3.92 billion, its primary geographies are Texas, California, and Michigan, with locations also in Arizona and Florida and select businesses operating in several other states as well as Canada. However, the company's operating margin is currently at 0, indicating potential challenges in profitability.
Financial Strength Analysis
Comerica Inc's financial strength indicators present some concerning insights about the company's balance sheet health. The company's low cash-to-debt ratio at 0.62 indicates a struggle in handling existing debt levels. Its debt-to-equity ratio is 2.95, which is worse than 91.72% of 1328 companies in the Banks industry. A high debt-to-equity ratio suggests over-reliance on borrowing and vulnerability to market fluctuations. Furthermore, the company's debt-to-Ebitda ratio is 9999, which is above Joel Tillinghast's warning level of 4 and is worse than 0% of 30 companies in the Banks industry.
Profitability Breakdown
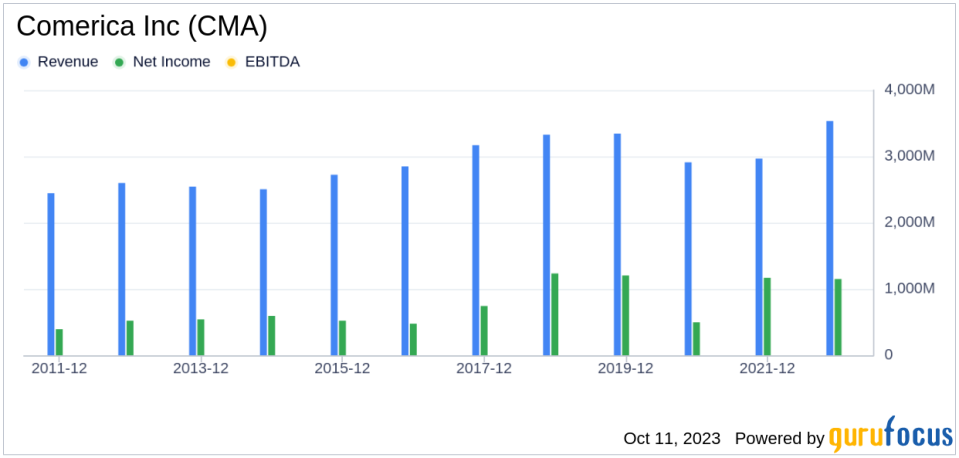
Comerica Inc's low Profitability rank can also raise warning signals. The company's Net Margin has declined over the past five years (-12.23%), as shown by the following data: 2018: 37.11; 2019: 35.96; 2020: 17.07; 2021: 39.37; 2022: 32.57.
Growth Prospects
A lack of significant growth is another area where Comerica Inc seems to falter, as evidenced by the company's low Growth rank. Lastly, Comerica Inc's predictability rank is just one star out of five, adding to investor uncertainty regarding revenue and earnings consistency.
Conclusion
Given Comerica Inc's financial strength, profitability, and growth metrics, the GF Score highlights the firm's unparalleled position for potential underperformance. While the company has a rich history and a strong presence in the banking industry, its current financial indicators suggest that it may struggle to maintain its past performance levels. Investors should consider these factors when making investment decisions.
GuruFocus Premium members can find more companies with strong GF Scores using the following screener link: GF Score Screen
This article, generated by GuruFocus, is designed to provide general insights and is not tailored financial advice. Our commentary is rooted in historical data and analyst projections, utilizing an impartial methodology, and is not intended to serve as specific investment guidance. It does not formulate a recommendation to purchase or divest any stock and does not consider individual investment objectives or financial circumstances. Our objective is to deliver long-term, fundamental data-driven analysis. Be aware that our analysis might not incorporate the most recent, price-sensitive company announcements or qualitative information. GuruFocus holds no position in the stocks mentioned herein.
This article first appeared on GuruFocus.
