The Compensation For Johns Lyng Group Limited's (ASX:JLG) CEO Looks Deserved And Here's Why
Key Insights
Johns Lyng Group's Annual General Meeting to take place on 22nd of November
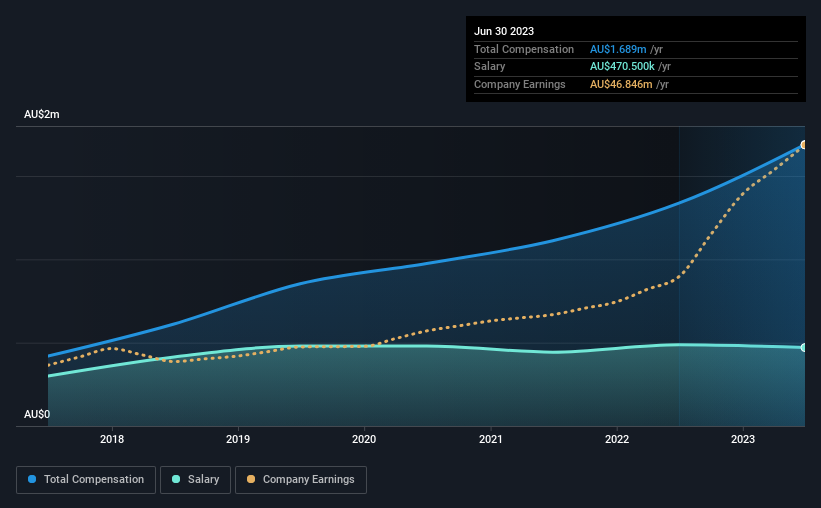
Total pay for CEO Scott Didier includes AU$470.5k salary
The overall pay is comparable to the industry average
Johns Lyng Group's EPS grew by 33% over the past three years while total shareholder return over the past three years was 116%
The performance at Johns Lyng Group Limited (ASX:JLG) has been quite strong recently and CEO Scott Didier has played a role in it. The pleasing results would be something shareholders would keep in mind at the upcoming AGM on 22nd of November. This would also be a chance for them to hear the board review the financial results, discuss future company strategy and vote on any resolutions such as executive remuneration. In light of the great performance, we discuss the case why we think CEO compensation is not excessive.
See our latest analysis for Johns Lyng Group
How Does Total Compensation For Scott Didier Compare With Other Companies In The Industry?
Our data indicates that Johns Lyng Group Limited has a market capitalization of AU$1.7b, and total annual CEO compensation was reported as AU$1.7m for the year to June 2023. We note that's an increase of 26% above last year. While this analysis focuses on total compensation, it's worth acknowledging that the salary portion is lower, valued at AU$471k.
On comparing similar companies from the Australian Construction industry with market caps ranging from AU$615m to AU$2.5b, we found that the median CEO total compensation was AU$1.7m. So it looks like Johns Lyng Group compensates Scott Didier in line with the median for the industry. What's more, Scott Didier holds AU$6.4m worth of shares in the company in their own name, indicating that they have a lot of skin in the game.
Component | 2023 | 2022 | Proportion (2023) |
Salary | AU$471k | AU$487k | 28% |
Other | AU$1.2m | AU$850k | 72% |
Total Compensation | AU$1.7m | AU$1.3m | 100% |
Talking in terms of the industry, salary represented approximately 63% of total compensation out of all the companies we analyzed, while other remuneration made up 37% of the pie. It's interesting to note that Johns Lyng Group allocates a smaller portion of compensation to salary in comparison to the broader industry. If non-salary compensation dominates total pay, it's an indicator that the executive's salary is tied to company performance.
A Look at Johns Lyng Group Limited's Growth Numbers
Johns Lyng Group Limited has seen its earnings per share (EPS) increase by 33% a year over the past three years. Its revenue is up 43% over the last year.
Overall this is a positive result for shareholders, showing that the company has improved in recent years. It's great to see that revenue growth is strong, too. These metrics suggest the business is growing strongly. Historical performance can sometimes be a good indicator on what's coming up next but if you want to peer into the company's future you might be interested in this free visualization of analyst forecasts.
Has Johns Lyng Group Limited Been A Good Investment?
Boasting a total shareholder return of 116% over three years, Johns Lyng Group Limited has done well by shareholders. As a result, some may believe the CEO should be paid more than is normal for companies of similar size.
In Summary...
The company's solid performance might have made most shareholders happy, possibly making CEO remuneration the least of the matters to be discussed in the AGM. In fact, strategic decisions that could impact the future of the business might be a far more interesting topic for investors as it would help them set their longer-term expectations.
CEO compensation is a crucial aspect to keep your eyes on but investors also need to keep their eyes open for other issues related to business performance. We did our research and spotted 1 warning sign for Johns Lyng Group that investors should look into moving forward.
Switching gears from Johns Lyng Group, if you're hunting for a pristine balance sheet and premium returns, this free list of high return, low debt companies is a great place to look.
Have feedback on this article? Concerned about the content? Get in touch with us directly. Alternatively, email editorial-team (at) simplywallst.com.
This article by Simply Wall St is general in nature. We provide commentary based on historical data and analyst forecasts only using an unbiased methodology and our articles are not intended to be financial advice. It does not constitute a recommendation to buy or sell any stock, and does not take account of your objectives, or your financial situation. We aim to bring you long-term focused analysis driven by fundamental data. Note that our analysis may not factor in the latest price-sensitive company announcements or qualitative material. Simply Wall St has no position in any stocks mentioned.
