Is Constellium SE's (NYSE:CSTM) High P/E Ratio A Problem For Investors?

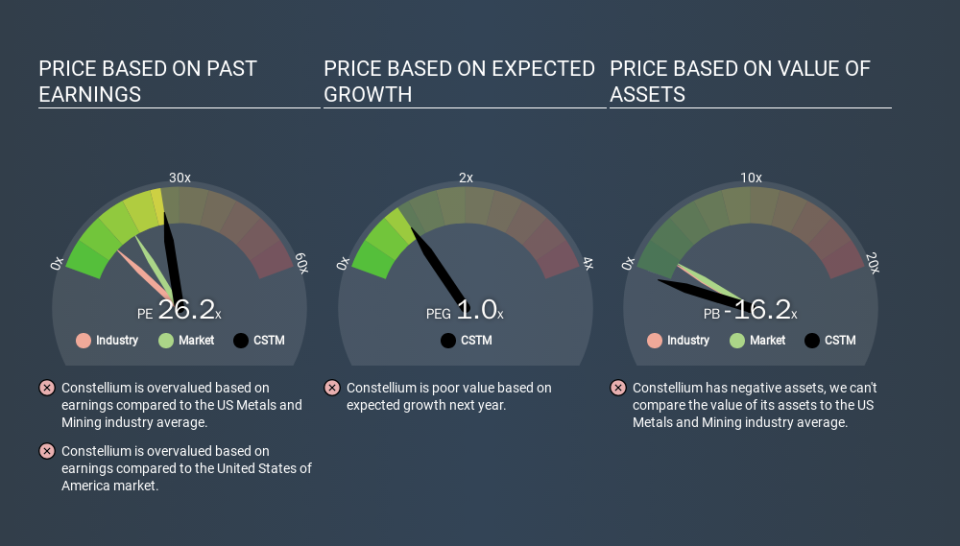
The goal of this article is to teach you how to use price to earnings ratios (P/E ratios). We'll show how you can use Constellium SE's (NYSE:CSTM) P/E ratio to inform your assessment of the investment opportunity. Constellium has a price to earnings ratio of 26.15, based on the last twelve months. That is equivalent to an earnings yield of about 3.8%.
View our latest analysis for Constellium
How Do I Calculate A Price To Earnings Ratio?
The formula for P/E is:
Price to Earnings Ratio = Share Price (in reporting currency) ÷ Earnings per Share (EPS)
Or for Constellium:
P/E of 26.15 = EUR11.28 (Note: this is the share price in the reporting currency, namely, EUR ) ÷ EUR0.43 (Based on the trailing twelve months to December 2019.)
Is A High Price-to-Earnings Ratio Good?
A higher P/E ratio means that investors are paying a higher price for each EUR1 of company earnings. That isn't necessarily good or bad, but a high P/E implies relatively high expectations of what a company can achieve in the future.
Does Constellium Have A Relatively High Or Low P/E For Its Industry?
The P/E ratio essentially measures market expectations of a company. As you can see below, Constellium has a higher P/E than the average company (9.9) in the metals and mining industry.
That means that the market expects Constellium will outperform other companies in its industry. Shareholders are clearly optimistic, but the future is always uncertain. So investors should delve deeper. I like to check if company insiders have been buying or selling.
How Growth Rates Impact P/E Ratios
Probably the most important factor in determining what P/E a company trades on is the earnings growth. That's because companies that grow earnings per share quickly will rapidly increase the 'E' in the equation. And in that case, the P/E ratio itself will drop rather quickly. A lower P/E should indicate the stock is cheap relative to others -- and that may attract buyers.
Constellium's earnings per share fell by 69% in the last twelve months. And it has shrunk its earnings per share by 2.4% per year over the last five years. This could justify a pessimistic P/E.
A Limitation: P/E Ratios Ignore Debt and Cash In The Bank
One drawback of using a P/E ratio is that it considers market capitalization, but not the balance sheet. So it won't reflect the advantage of cash, or disadvantage of debt. The exact same company would hypothetically deserve a higher P/E ratio if it had a strong balance sheet, than if it had a weak one with lots of debt, because a cashed up company can spend on growth.
While growth expenditure doesn't always pay off, the point is that it is a good option to have; but one that the P/E ratio ignores.
Is Debt Impacting Constellium's P/E?
Constellium has net debt worth a very significant 125% of its market capitalization. If you want to compare its P/E ratio to other companies, you must keep in mind that these debt levels would usually warrant a relatively low P/E.
The Bottom Line On Constellium's P/E Ratio
Constellium's P/E is 26.2 which is above average (16.5) in its market. With meaningful debt and a lack of recent earnings growth, the market has high expectations that the business will earn more in the future.
When the market is wrong about a stock, it gives savvy investors an opportunity. If the reality for a company is better than it expects, you can make money by buying and holding for the long term. So this free visualization of the analyst consensus on future earnings could help you make the right decision about whether to buy, sell, or hold.
You might be able to find a better buy than Constellium. If you want a selection of possible winners, check out this free list of interesting companies that trade on a P/E below 20 (but have proven they can grow earnings).
If you spot an error that warrants correction, please contact the editor at editorial-team@simplywallst.com. This article by Simply Wall St is general in nature. It does not constitute a recommendation to buy or sell any stock, and does not take account of your objectives, or your financial situation. Simply Wall St has no position in the stocks mentioned.
We aim to bring you long-term focused research analysis driven by fundamental data. Note that our analysis may not factor in the latest price-sensitive company announcements or qualitative material. Thank you for reading.
