Continental (ETR:CON) shareholders have endured a 64% loss from investing in the stock five years ago
Generally speaking long term investing is the way to go. But no-one is immune from buying too high. For example, after five long years the Continental Aktiengesellschaft (ETR:CON) share price is a whole 72% lower. That is extremely sub-optimal, to say the least. The falls have accelerated recently, with the share price down 13% in the last three months. This could be related to the recent financial results - you can catch up on the most recent data by reading our company report.
Since shareholders are down over the longer term, lets look at the underlying fundamentals over the that time and see if they've been consistent with returns.
See our latest analysis for Continental
While the efficient markets hypothesis continues to be taught by some, it has been proven that markets are over-reactive dynamic systems, and investors are not always rational. By comparing earnings per share (EPS) and share price changes over time, we can get a feel for how investor attitudes to a company have morphed over time.
Continental became profitable within the last five years. That would generally be considered a positive, so we are surprised to see the share price is down. Other metrics may better explain the share price move.
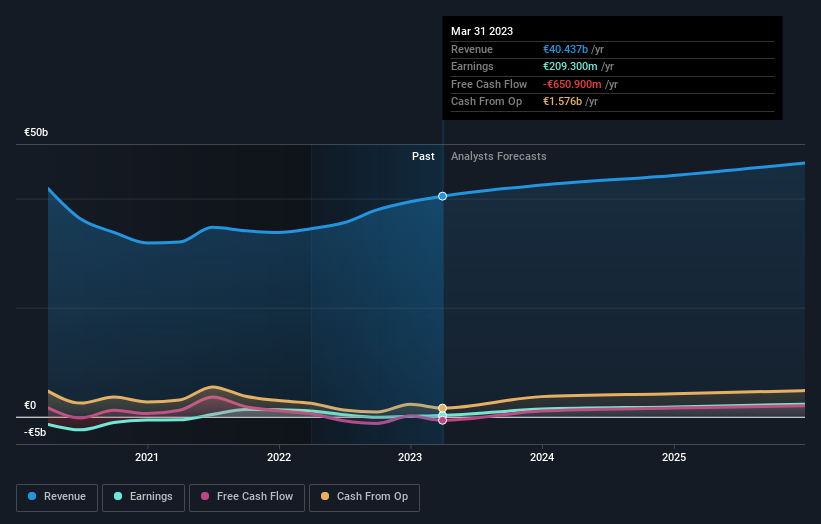
Arguably, the revenue drop of 5.4% a year for half a decade suggests that the company can't grow in the long term. This has probably encouraged some shareholders to sell down the stock.
You can see below how earnings and revenue have changed over time (discover the exact values by clicking on the image).
Continental is well known by investors, and plenty of clever analysts have tried to predict the future profit levels. Given we have quite a good number of analyst forecasts, it might be well worth checking out this free chart depicting consensus estimates.
What About Dividends?
As well as measuring the share price return, investors should also consider the total shareholder return (TSR). The TSR incorporates the value of any spin-offs or discounted capital raisings, along with any dividends, based on the assumption that the dividends are reinvested. So for companies that pay a generous dividend, the TSR is often a lot higher than the share price return. We note that for Continental the TSR over the last 5 years was -64%, which is better than the share price return mentioned above. This is largely a result of its dividend payments!
A Different Perspective
While the broader market lost about 3.8% in the twelve months, Continental shareholders did even worse, losing 10% (even including dividends). Having said that, it's inevitable that some stocks will be oversold in a falling market. The key is to keep your eyes on the fundamental developments. Unfortunately, longer term shareholders are suffering worse, given the loss of 10% doled out over the last five years. We'd need to see some sustained improvements in the key metrics before we could muster much enthusiasm. I find it very interesting to look at share price over the long term as a proxy for business performance. But to truly gain insight, we need to consider other information, too. For example, we've discovered 4 warning signs for Continental (2 are potentially serious!) that you should be aware of before investing here.
Of course, you might find a fantastic investment by looking elsewhere. So take a peek at this free list of companies we expect will grow earnings.
Please note, the market returns quoted in this article reflect the market weighted average returns of stocks that currently trade on German exchanges.
Have feedback on this article? Concerned about the content? Get in touch with us directly. Alternatively, email editorial-team (at) simplywallst.com.
This article by Simply Wall St is general in nature. We provide commentary based on historical data and analyst forecasts only using an unbiased methodology and our articles are not intended to be financial advice. It does not constitute a recommendation to buy or sell any stock, and does not take account of your objectives, or your financial situation. We aim to bring you long-term focused analysis driven by fundamental data. Note that our analysis may not factor in the latest price-sensitive company announcements or qualitative material. Simply Wall St has no position in any stocks mentioned.
Join A Paid User Research Session
You’ll receive a US$30 Amazon Gift card for 1 hour of your time while helping us build better investing tools for the individual investors like yourself. Sign up here
