Service Corporation (SCI) Q3 Earnings Lag, Revenues Beat


After delivering seven consecutive beats, Service Corporation International SCI marked its first earnings miss in third-quarter 2018. Nevertheless, both top and bottom lines improved year over year and the former beat the Zacks Consensus Estimate for the second time in a row.
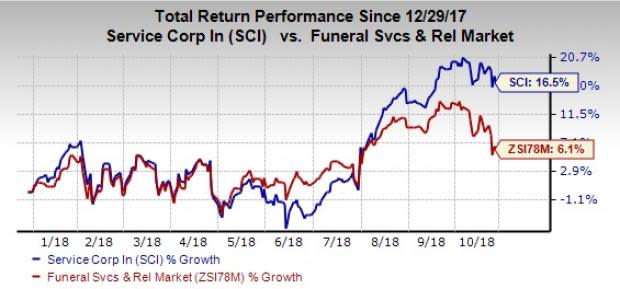
Service Corporation’s past record has helped this Zacks Rank #3 (Hold) stock rally 16.5% this year, outpacing the industry’s growth of 6.1%.
Adjusted earnings increased 6.1% year over year to 35 cents per share, though it came a penny below the Zacks Consensus Estimate. The year-over-year upside was backed by solid operating profit, lower adjusted tax rate and reduced share count, partly offset by escalated general and administrative costs and increased interest expenses.
Service Corporation International Price, Consensus and EPS Surprise
Service Corporation International Price, Consensus and EPS Surprise | Service Corporation International Quote
Adjusted effective tax rate was 17.6% in the third quarter of 2018 compared with 19.5% in the same period last year.
Total revenues came in at $778.8 million, up 6.5% from $731.3 million in the year-ago period. Moreover, the figure surpassed the consensus mark of $762 million. Greater funeral and cemetery revenues boosted results.
Segment Discussion
Comparable Funeral revenues rose 1.9% on the back of higher general agency revenues and increased recognized preneed revenues. The latter was a result of greater contracts sold through the company’s non-funeral home sales network. Core revenues remained nearly flat as a rise in core average revenue per service was negated by lower core funeral services performed.
Comparable preneed funeral sales production grew 13.6%, driven by strength in core and non-funeral home channels. This, in turn, was fueled by newly introduced consumer-facing technology along with digital marketing campaigns, website remodeling and optimization of search engine.
Comparable funeral operating profit declined 4.4% to $67.5 million and the operating margin contracted 100 basis points (bps) to 15.4%. This was a result of higher funeral fixed costs, owing to escalated wages of customer-facing workers and increased self-insured medical claims. Moreover, increased selling and marketing expenses led to the drop in operating profit.
Comparable Cemetery revenues rose 9.9% year over year, courtesy of improved sales production, cemetery property construction projects completion and greater income from endowment care trust fund.
Comparable preneed cemetery sales production grew 5.4% on account of higher preneed property production, and increased preneed merchandise and services production.
Comparable cemetery operating profit rose 21.2% to $96.1 million, with the respective margin expanding 280 bps to 29.9%. The upside was driven by higher revenues, somewhat negated by escalated labor expenses, greater digital marketing investments and increased self-insured medical claims.
Costs
Adjusted general and administrative costs went up $13.6 million, owing to higher costs associated with Service Corporation’s long-term incentive compensation program.
The company’s interest costs rose $3.7 million due to higher interest rates on the company’s floating rate debt and increased total debt.
Other Financial Details
Service Corporation ended the quarter with cash and cash equivalents of $158.3 million, long-term debt of $3,542.3 million and total equity of approximately $1,489 million.
Net cash from operating activities (excluding special items) amounted to $136.9 million in the quarter, which was lower than the previous year, due to higher cash taxes. Also, lower preneed working capital was responsible for this downside.
During the third quarter, Service Corporation returned $77.6 million to shareholders via dividends and share buybacks, while it returned $368.7 million in the first nine months ended Sep 30.
Also, the company incurred capital expenditures of $63.1 million and $165.9 million during the third quarter and first nine months ended Sep 30, respectively.
Outlook
Management is impressed with the solid revenue and operating profit growth, and expects the strong operating performance to continue in the fourth quarter. Going ahead, the company is focused on its long-term growth strategy, and on track to augment revenues, utilize its expanding scale, and deploy capital efficiently to augment shareholders’ value.
Management continues to expect net cash from operating activities for 2018 to range between $575 million and $615 million. The company still plans to allocate about $195 million toward capital enhancements at existing facilities and cemetery development.
Adjusted earnings per share for the year is now envisioned to be $1.77-$1.85 compared with the previous range of $1.72-$1.90.
Check Out These Solid Consumer Staples Stocks
Chefs’ Warehouse CHEF, with long-term earnings per share growth rate of 19%, carries a Zacks Rank #1 (Strong Buy). You can see the complete list of today’s Zacks #1 Rank stocks here.
McCormick & Company, Incorporated MKC has long-term earnings per share growth rate of 9% and a Zacks Rank #2 (Buy).
Lamb Weston LW, with a Zacks Rank #2, has long-term earnings per share growth rate of 11%.
The Hottest Tech Mega-Trend of All
Last year, it generated $8 billion in global revenues. By 2020, it's predicted to blast through the roof to $47 billion. Famed investor Mark Cuban says it will produce "the world's first trillionaires," but that should still leave plenty of money for regular investors who make the right trades early.
See Zacks' 3 Best Stocks to Play This Trend >>
Want the latest recommendations from Zacks Investment Research? Today, you can download 7 Best Stocks for the Next 30 Days. Click to get this free report
McCormick & Company, Incorporated (MKC) : Free Stock Analysis Report
The Chefs' Warehouse, Inc. (CHEF) : Free Stock Analysis Report
Lamb Weston Holdings Inc. (LW) : Free Stock Analysis Report
Service Corporation International (SCI) : Free Stock Analysis Report
To read this article on Zacks.com click here.
