Costco, Home Depot and Floor & Decor: Diverging Outcomes From a Similar Model
Costco Wholesale Corp. (NASDAQ:COST) is well known for being a global retail giant with a huge moat. The late Charlie Munger (Trades, Portfolio) often proclaimed his love for the company: I love everything about Costco. I'm total addict, and I'm never going to sell a share. In the U.S., retail chains like The Home Depot Inc.(NYSE:HD) and Floor & Decor Holdings Inc. (NYSE:FND) have copied its business model.
Although these three retailers share similar business models, their outcomes and operational efficiencies vary, with Costco leading in efficiency, followed by Home Depot and then Floor & Decor.
The volume company, not a margin company
Costco's business model focuses on generating high sales volumes rather than maximizing profit margins on individual products. Craig Jelinek, Costco's CEO, also explained the essence of the business: We are the volume company, not a margin company.
Shopping at Costco requires a membership. The company offers high-quality products at exceptional prices, fostering a loyal customer base that drives substantial traffic and volume. This high traffic grants it significant leverage in negotiations with suppliers. Munger once commented that Costco does not hold investments in inventory. Instead, the company delays payment to suppliers until after it has received payment for the products, scheduling supplier payments only once the items are slated for sale. This purchasing power enables the retailer to obtain top-quality products at the lowest costs from suppliers, further enhancing the value offered to its members.
Costco has the most efficient operations
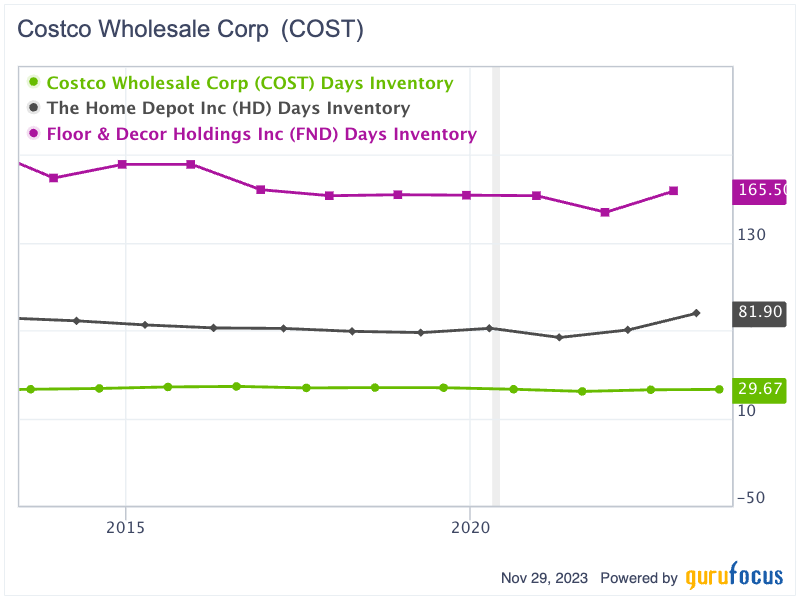
When examining operating efficiency, Costco distinctly outperforms the other two retailers, showcasing superior operating performance and efficiency. Over the past decade, it has maintained a stunningly high inventory turnover rate, with its average days inventory outstanding consistently ranging between 28 and 32 days. In contrast, Home Depot exhibits a significantly higher DIO, with an average of 65 to 82 days. The most pronounced difference is seen in Floor & Decor, which takes the longest time to turn inventory into sales, ranging from 152 to 187 daysabout five to six times slower than Costco.
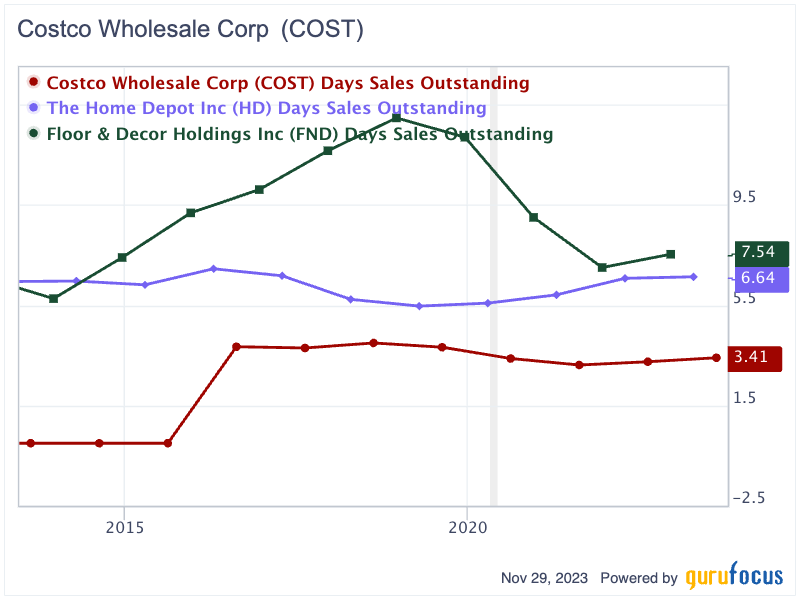
Regarding the efficiency of collecting payments post-sale, Costco again emerged as the leader. Since 2012, its days sales outstanding have been impressively brief, ranging from just three to four days. Home Depot follows, albeit with a slightly higher DSO of 5.5 to eight days. Although Floor & Decor outperformed Home Depot in 2013 with a marginally lower DSO, it has consistently taken the longest to collect payment for its sales from 2014 through 2022, with a DSO in the range of seven to 13 days.
In terms of supplier payments, Floor & Decor has the capacity to delay payments to its suppliers the longest, while Costco stands out for paying its suppliers the soonest. This approach aligns logically with Costco's ability to receive payments from sales much more quickly than both Home Depot and Floor & Decor, facilitating its faster payment cycle to suppliers.
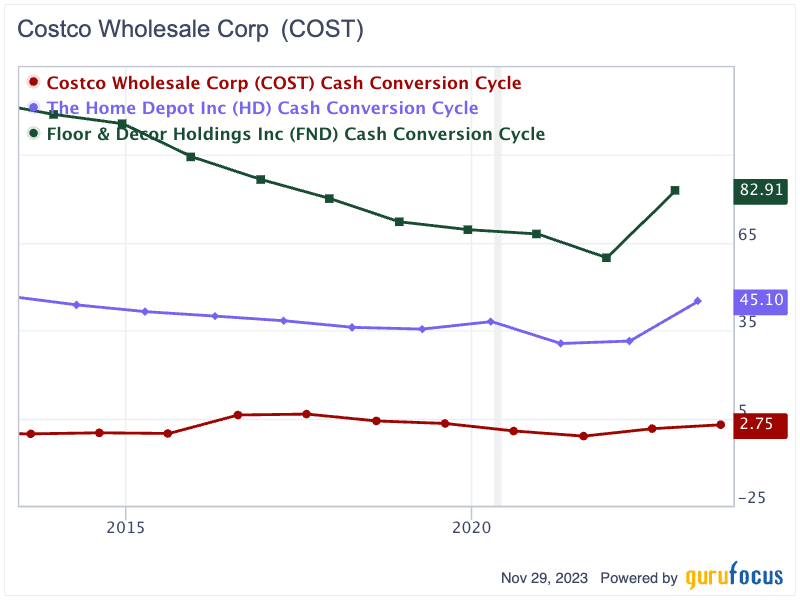
The cash conversion cycle is an integral metric that combines all three aforementioned efficiency ratios. It is a crucial metric that measures the time a company takes to convert its investments in inventory, receivables and other resources into cash flows from sales. Costco's CCC is particularly impressive, thanks to its low days sales outstanding and high inventory turnover. This efficiency has not only been consistently remarkable, but has also improved over time. Between 2012 and 2019, its CCC remained within a strikingly short range of three to seven days. In 2021, Costco achieved a negative CCC, indicating its operations were essentially financed by its vendors. Home Depot, while efficient, ranks second with a CCC of 31 to 48 days. In stark contrast, Floor & Decor's CCC is considerably higher, ranging from 75 to 120 days, demonstrating a much slower conversion of resources to cash compared to Costco.
Home Depot has the highest profitability ratios
Due to its low-price strategy, Costco has the lowest profit margin among the three companies. Its net margin ranged from just 1.8% to 2.6%, while Floor & Decor's profit margin was slightly higher. Home Depot leads in terms of profitability, starting with a 6% profit margin in 2012 and gradually climbing to nearly 10.9% at the time of this writing.
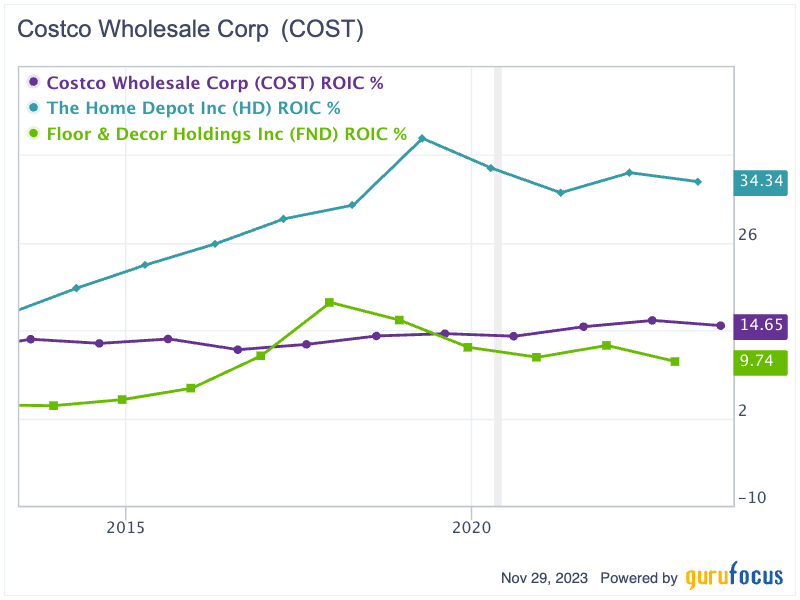
In the realm of return on invested capital, Home Depot again stands out. Its return on invested capital increased from 19.8% in 2014, reaching a peak of 40.28% in 2018, before stabilizing at 34.34% in 2022. Costco ranks second with a 14.65% return on invested capital, while Floor & Decor trails with a significantly lower return on invested capital of only 9.74% in 2022.
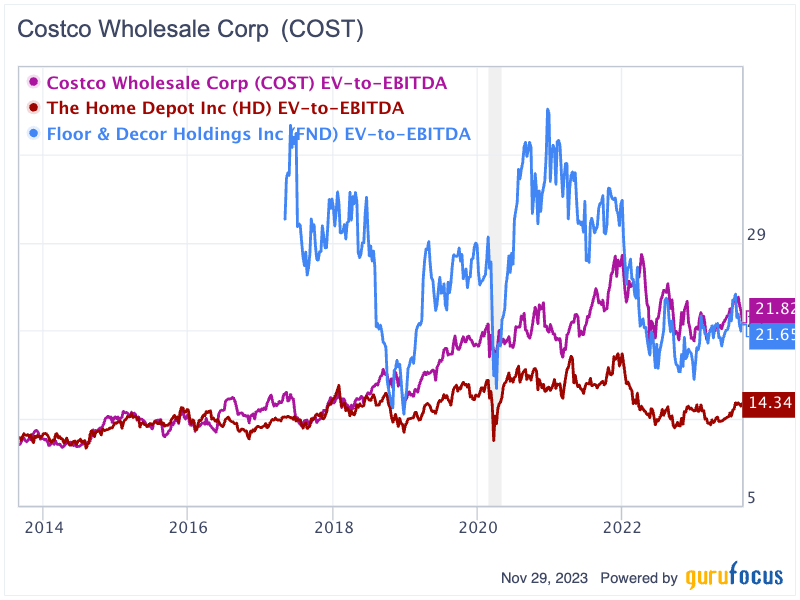
Costco is the highest valued among the three
From 2013 to 2018, the valuations of Home Depot and Costco were quite similar, with their Ebitda multiples hovering around 11 times to 16 times. Subsequently, however, their valuations began to diverge. Costco's multiples increased, surpassing those of Home Depot, whose Ebitda multiples were more stable. During the past decade, Costco's highest Ebitda multiple nearly reached 30 times, while Home Depot's peak was at only 19.4. In contrast, Floor & Decor has the most fluctuating multiples, ranging broadly from 13.2 to as high as 43.
At the time of writing, Costco holds the highest valuation with an enterprise value/Ebitda multiple of nearly 21.82. Floor & Decor follows, valued slightly lower at 21.65, while Home Depot has the most modest valuation among the three with an enterprise value/Ebitda ratio of only 14.34.
Key takeaway
Costco has crafted a unique business model that prioritizes volume over margins, cultivating an impressive efficiency in inventory turnover and a quick cash conversion cycle. This model not only ensures a consistent flow of high-quality products at competitive prices, but also fortifies the company's financial health and customer loyalty. While Home Depot and Floor & Decor have attempted to replicate Costco's successful strategy, their outcomes vary significantly. Home Depot, though trailing behind in operational efficiency, excels in profitability and return on invested capital. Floor & Decor, meanwhile, faces challenges in inventory turnover and cash conversion, reflecting the diverse challenges inherent in the retail sector. Among the three, Costco, with its excellecent in operating efficiency, and Home Depot, with the highest margin and return invested on capital, seem to fit well in long-term investors' portfolios.
This article first appeared on GuruFocus.
