Could The Ennis, Inc. (NYSE:EBF) Ownership Structure Tell Us Something Useful?
A look at the shareholders of Ennis, Inc. (NYSE:EBF) can tell us which group is most powerful. Large companies usually have institutions as shareholders, and we usually see insiders owning shares in smaller companies. Companies that used to be publicly owned tend to have lower insider ownership.
Ennis is a smaller company with a market capitalization of US$555m, so it may still be flying under the radar of many institutional investors. Our analysis of the ownership of the company, below, shows that institutional investors have bought into the company. We can zoom in on the different ownership groups, to learn more about Ennis.
View our latest analysis for Ennis
What Does The Institutional Ownership Tell Us About Ennis?
Institutional investors commonly compare their own returns to the returns of a commonly followed index. So they generally do consider buying larger companies that are included in the relevant benchmark index.
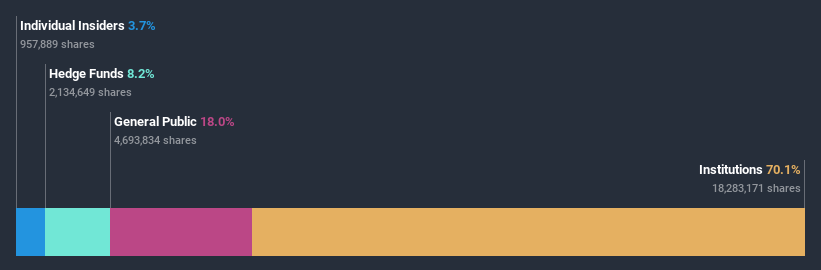
We can see that Ennis does have institutional investors; and they hold a good portion of the company's stock. This implies the analysts working for those institutions have looked at the stock and they like it. But just like anyone else, they could be wrong. If multiple institutions change their view on a stock at the same time, you could see the share price drop fast. It's therefore worth looking at Ennis' earnings history below. Of course, the future is what really matters.
Investors should note that institutions actually own more than half the company, so they can collectively wield significant power. It looks like hedge funds own 8.2% of Ennis shares. That's interesting, because hedge funds can be quite active and activist. Many look for medium term catalysts that will drive the share price higher. The company's largest shareholder is BlackRock, Inc., with ownership of 8.9%. For context, the second largest shareholder holds about 8.2% of the shares outstanding, followed by an ownership of 8.1% by the third-largest shareholder. Furthermore, CEO Keith Walters is the owner of 1.8% of the company's shares.
We did some more digging and found that 9 of the top shareholders account for roughly 52% of the register, implying that along with larger shareholders, there are a few smaller shareholders, thereby balancing out each others interests somewhat.
While it makes sense to study institutional ownership data for a company, it also makes sense to study analyst sentiments to know which way the wind is blowing. We're not picking up on any analyst coverage of the stock at the moment, so the company is unlikely to be widely held.
Insider Ownership Of Ennis
The definition of company insiders can be subjective and does vary between jurisdictions. Our data reflects individual insiders, capturing board members at the very least. Management ultimately answers to the board. However, it is not uncommon for managers to be executive board members, especially if they are a founder or the CEO.
I generally consider insider ownership to be a good thing. However, on some occasions it makes it more difficult for other shareholders to hold the board accountable for decisions.
Shareholders would probably be interested to learn that insiders own shares in Ennis, Inc.. In their own names, insiders own US$20m worth of stock in the US$555m company. It is good to see some investment by insiders, but it might be worth checking if those insiders have been buying.
General Public Ownership
The general public holds a 18% stake in Ennis. While this group can't necessarily call the shots, it can certainly have a real influence on how the company is run.
Next Steps:
It's always worth thinking about the different groups who own shares in a company. But to understand Ennis better, we need to consider many other factors.
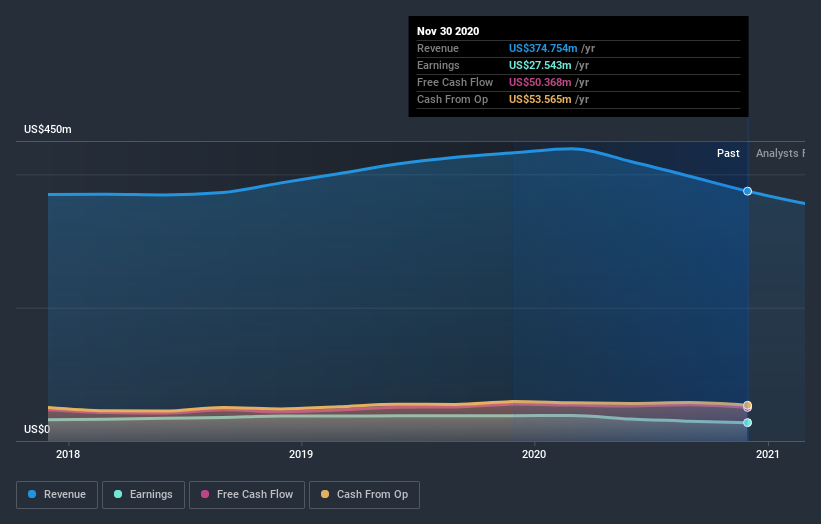
Many find it useful to take an in depth look at how a company has performed in the past. You can access this detailed graph of past earnings, revenue and cash flow.
Of course this may not be the best stock to buy. So take a peek at this free free list of interesting companies.
NB: Figures in this article are calculated using data from the last twelve months, which refer to the 12-month period ending on the last date of the month the financial statement is dated. This may not be consistent with full year annual report figures.
This article by Simply Wall St is general in nature. It does not constitute a recommendation to buy or sell any stock, and does not take account of your objectives, or your financial situation. We aim to bring you long-term focused analysis driven by fundamental data. Note that our analysis may not factor in the latest price-sensitive company announcements or qualitative material. Simply Wall St has no position in any stocks mentioned.
Have feedback on this article? Concerned about the content? Get in touch with us directly. Alternatively, email editorial-team (at) simplywallst.com.
