Could The Kambi Group plc (STO:KAMBI) Ownership Structure Tell Us Something Useful?

Want to participate in a short research study? Help shape the future of investing tools and you could win a $250 gift card!
The big shareholder groups in Kambi Group plc (STO:KAMBI) have power over the company. Generally speaking, as a company grows, institutions will increase their ownership. Conversely, insiders often decrease their ownership over time. Companies that used to be publicly owned tend to have lower insider ownership.
Kambi Group is not a large company by global standards. It has a market capitalization of kr6.3b, which means it wouldn’t have the attention of many institutional investors. Our analysis of the ownership of the company, below, shows that institutional investors have bought into the company. We can zoom in on the different ownership groups, to learn more about KAMBI.
View our latest analysis for Kambi Group

What Does The Institutional Ownership Tell Us About Kambi Group?
Many institutions measure their performance against an index that approximates the local market. So they usually pay more attention to companies that are included in major indices.
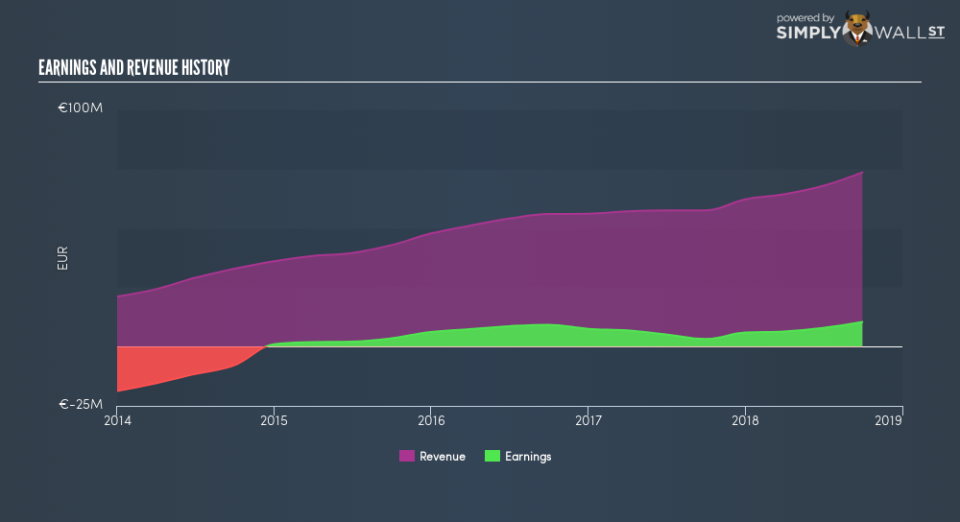
We can see that Kambi Group does have institutional investors; and they hold 25% of the stock. This can indicate that the company has a certain degree of credibility in the investment community. However, it is best to be wary of relying on the supposed validation that comes with institutional investors. They too, get it wrong sometimes. It is not uncommon to see a big share price drop if two large institutional investors try to sell out of a stock at the same time. So it is worth checking the past earnings trajectory of Kambi Group, (below). Of course, keep in mind that there are other factors to consider, too.
Our data indicates that hedge funds own 15% of Kambi Group. That’s interesting, because hedge funds can be quite active and activist. Many look for medium term catalysts that will drive the share price higher. There are plenty of analysts covering the stock, so it might be worth seeing what they are forecasting, too.
Insider Ownership Of Kambi Group
The definition of company insiders can be subjective, and does vary between jurisdictions. Our data reflects individual insiders, capturing board members at the very least. Management ultimately answers to the board. However, it is not uncommon for managers to be executive board members, especially if they are a founder or the CEO.
Most consider insider ownership a positive because it can indicate the board is well aligned with other shareholders. However, on some occasions too much power is concentrated within this group.
I can report that insiders do own shares in Kambi Group plc. In their own names, insiders own kr226m worth of stock in the kr6.3b company. It is good to see some investment by insiders, but it might be worth checking if those insiders have been buying.
General Public Ownership
The general public holds a 32% stake in KAMBI. While this size of ownership may not be enough to sway a policy decision in their favour, they can still make a collective impact on company policies.
Private Company Ownership
Our data indicates that Private Companies hold 24%, of the company’s shares. Private companies may be related parties. Sometimes insiders have an interest in a public company through a holding in a private company, rather than in their own capacity as an individual. While it’s hard to draw any broad stroke conclusions, it is worth noting as an area for further research.
Next Steps:
While it is well worth considering the different groups that own a company, there are other factors that are even more important.
I like to dive deeper into how a company has performed in the past. You can find historic revenue and earnings in this detailed graph.
Ultimately the future is most important. You can access this free report on analyst forecasts for the company.
NB: Figures in this article are calculated using data from the last twelve months, which refer to the 12-month period ending on the last date of the month the financial statement is dated. This may not be consistent with full year annual report figures.
To help readers see past the short term volatility of the financial market, we aim to bring you a long-term focused research analysis purely driven by fundamental data. Note that our analysis does not factor in the latest price-sensitive company announcements.
The author is an independent contributor and at the time of publication had no position in the stocks mentioned. For errors that warrant correction please contact the editor at editorial-team@simplywallst.com.
