Could The Market Be Wrong About tinyBuild, Inc. (LON:TBLD) Given Its Attractive Financial Prospects?
It is hard to get excited after looking at tinyBuild's (LON:TBLD) recent performance, when its stock has declined 17% over the past three months. However, stock prices are usually driven by a company’s financial performance over the long term, which in this case looks quite promising. Specifically, we decided to study tinyBuild's ROE in this article.
Return on equity or ROE is an important factor to be considered by a shareholder because it tells them how effectively their capital is being reinvested. In simpler terms, it measures the profitability of a company in relation to shareholder's equity.
View our latest analysis for tinyBuild
How Do You Calculate Return On Equity?
The formula for ROE is:
Return on Equity = Net Profit (from continuing operations) ÷ Shareholders' Equity
So, based on the above formula, the ROE for tinyBuild is:
10% = US$12m ÷ US$112m (Based on the trailing twelve months to December 2022).
The 'return' is the amount earned after tax over the last twelve months. That means that for every £1 worth of shareholders' equity, the company generated £0.10 in profit.
What Is The Relationship Between ROE And Earnings Growth?
We have already established that ROE serves as an efficient profit-generating gauge for a company's future earnings. Depending on how much of these profits the company reinvests or "retains", and how effectively it does so, we are then able to assess a company’s earnings growth potential. Assuming everything else remains unchanged, the higher the ROE and profit retention, the higher the growth rate of a company compared to companies that don't necessarily bear these characteristics.
tinyBuild's Earnings Growth And 10% ROE
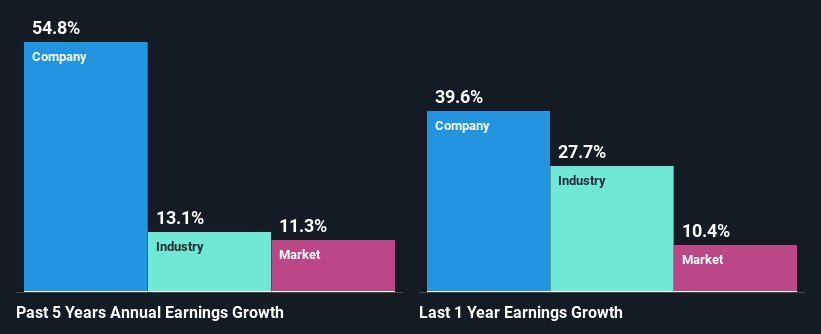
To start with, tinyBuild's ROE looks acceptable. Further, the company's ROE is similar to the industry average of 10%. Consequently, this likely laid the ground for the impressive net income growth of 55% seen over the past five years by tinyBuild. However, there could also be other drivers behind this growth. Such as - high earnings retention or an efficient management in place.
As a next step, we compared tinyBuild's net income growth with the industry, and pleasingly, we found that the growth seen by the company is higher than the average industry growth of 13%.
The basis for attaching value to a company is, to a great extent, tied to its earnings growth. The investor should try to establish if the expected growth or decline in earnings, whichever the case may be, is priced in. Doing so will help them establish if the stock's future looks promising or ominous. One good indicator of expected earnings growth is the P/E ratio which determines the price the market is willing to pay for a stock based on its earnings prospects. So, you may want to check if tinyBuild is trading on a high P/E or a low P/E, relative to its industry.
Is tinyBuild Using Its Retained Earnings Effectively?
tinyBuild doesn't pay any dividend to its shareholders, meaning that the company has been reinvesting all of its profits into the business. This is likely what's driving the high earnings growth number discussed above.
Conclusion
Overall, we are quite pleased with tinyBuild's performance. Particularly, we like that the company is reinvesting heavily into its business, and at a high rate of return. Unsurprisingly, this has led to an impressive earnings growth. Having said that, the company's earnings growth is expected to slow down, as forecasted in the current analyst estimates. To know more about the latest analysts predictions for the company, check out this visualization of analyst forecasts for the company.
Have feedback on this article? Concerned about the content? Get in touch with us directly. Alternatively, email editorial-team (at) simplywallst.com.
This article by Simply Wall St is general in nature. We provide commentary based on historical data and analyst forecasts only using an unbiased methodology and our articles are not intended to be financial advice. It does not constitute a recommendation to buy or sell any stock, and does not take account of your objectives, or your financial situation. We aim to bring you long-term focused analysis driven by fundamental data. Note that our analysis may not factor in the latest price-sensitive company announcements or qualitative material. Simply Wall St has no position in any stocks mentioned.
Join A Paid User Research Session
You’ll receive a US$30 Amazon Gift card for 1 hour of your time while helping us build better investing tools for the individual investors like yourself. Sign up here
