Could The Newater Technology, Inc. (NASDAQ:NEWA) Ownership Structure Tell Us Something Useful?

Want to participate in a short research study? Help shape the future of investing tools and you could win a $250 gift card!
Every investor in Newater Technology, Inc. (NASDAQ:NEWA) should be aware of the most powerful shareholder groups. Institutions will often hold stock in bigger companies, and we expect to see insiders owning a noticeable percentage of the smaller ones. I quite like to see at least a little bit of insider ownership. As Charlie Munger said 'Show me the incentive and I will show you the outcome.'
Newater Technology is not a large company by global standards. It has a market capitalization of US$56m, which means it wouldn't have the attention of many institutional investors. Taking a look at our data on the ownership groups (below), it's seems that institutions are not really that prevalent on the share registry. Let's take a closer look to see what the different types of shareholder can tell us about NEWA.
See our latest analysis for Newater Technology
What Does The Institutional Ownership Tell Us About Newater Technology?
Many institutions measure their performance against an index that approximates the local market. So they usually pay more attention to companies that are included in major indices.
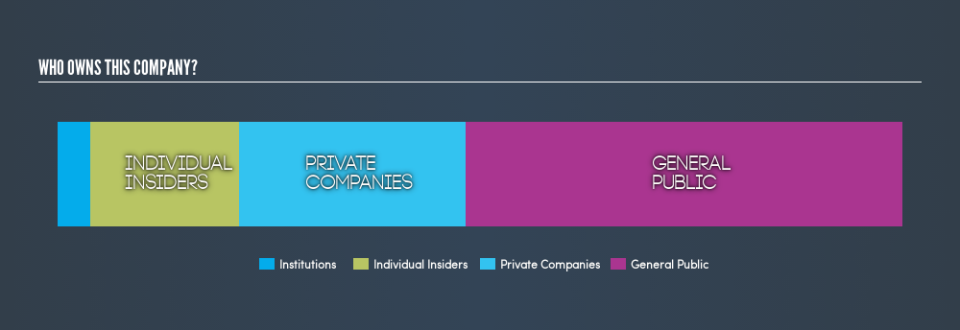
Institutions own less than 5% of Newater Technology. That indicates that the company is on the radar of some funds, but it isn't particularly popular with professional investors at the moment. If the company is growing earnings, that may indicate that it is just beginning to catch the attention of these deep-pocketed investors. We sometimes see a rising share price when a few big institutions want to buy a certain stock at the same time. The history of earnings and revenue, which you can see below, could be helpful in considering if more institutional investors will want the stock. Of course, there are plenty of other factors to consider, too.

Newater Technology is not owned by hedge funds. Our information suggests that there isn't any analyst coverage of the stock, so it is probably little known.
Insider Ownership Of Newater Technology
While the precise definition of an insider can be subjective, almost everyone considers board members to be insiders. Company management run the business, but the CEO will answer to the board, even if he or she is a member of it.
Most consider insider ownership a positive because it can indicate the board is well aligned with other shareholders. However, on some occasions too much power is concentrated within this group.
It seems insiders own a significant proportion of Newater Technology, Inc.. Insiders own US$9.9m worth of shares in the US$56m company. It is great to see insiders so invested in the business. It might be worth checking if those insiders have been buying recently.
General Public Ownership
The general public, who are mostly retail investors, collectively hold 52% of Newater Technology shares. With this size of ownership, retail investors can collectively play a role in decisions that affect shareholder returns, such as dividend policies and the appointment of directors. They can also exercise the power to decline an acquisition or merger that may not improve profitability.
Private Company Ownership
We can see that Private Companies own 27%, of the shares on issue. Private companies may be related parties. Sometimes insiders have an interest in a public company through a holding in a private company, rather than in their own capacity as an individual. While it's hard to draw any broad stroke conclusions, it is worth noting as an area for further research.
Next Steps:
I find it very interesting to look at who exactly owns a company. But to truly gain insight, we need to consider other information, too.
Many find it useful to take an in depth look at how a company has performed in the past. You can access this detailed graph of past earnings, revenue and cash flow .
Of course this may not be the best stock to buy. So take a peek at this free free list of interesting companies.
NB: Figures in this article are calculated using data from the last twelve months, which refer to the 12-month period ending on the last date of the month the financial statement is dated. This may not be consistent with full year annual report figures.
We aim to bring you long-term focused research analysis driven by fundamental data. Note that our analysis may not factor in the latest price-sensitive company announcements or qualitative material.
If you spot an error that warrants correction, please contact the editor at editorial-team@simplywallst.com. This article by Simply Wall St is general in nature. It does not constitute a recommendation to buy or sell any stock, and does not take account of your objectives, or your financial situation. Simply Wall St has no position in the stocks mentioned. Thank you for reading.
