Could SpeedCast International Limited’s (ASX:SDA) Investor Composition Influence The Stock Price?

Want to participate in a short research study? Help shape the future of investing tools and receive a $20 prize!
Every investor in SpeedCast International Limited (ASX:SDA) should be aware of the most powerful shareholder groups. Generally speaking, as a company grows, institutions will increase their ownership. Conversely, insiders often decrease their ownership over time. I generally like to see some degree of insider ownership, even if only a little. As Nassim Nicholas Taleb said, ‘Don’t tell me what you think, tell me what you have in your portfolio.’
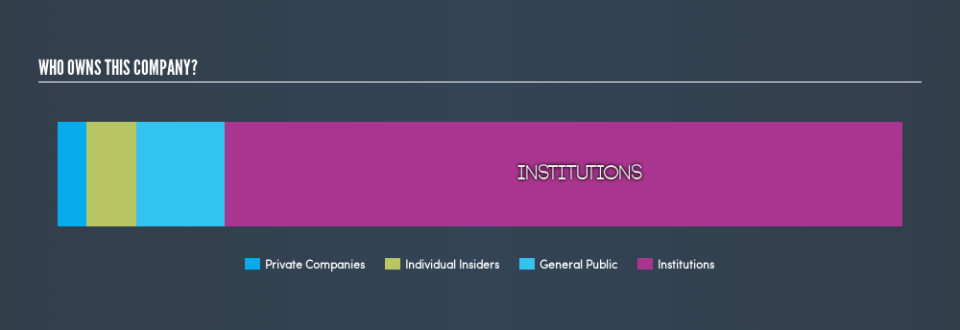
SpeedCast International is not a large company by global standards. It has a market capitalization of AU$797m, which means it wouldn’t have the attention of many institutional investors. In the chart below below, we can see that institutions own shares in the company. We can zoom in on the different ownership groups, to learn more about SDA.
View our latest analysis for SpeedCast International
What Does The Institutional Ownership Tell Us About SpeedCast International?
Institutions typically measure themselves against a benchmark when reporting to their own investors, so they often become more enthusiastic about a stock once it’s included in a major index. We would expect most companies to have some institutions on the register, especially if they are growing.
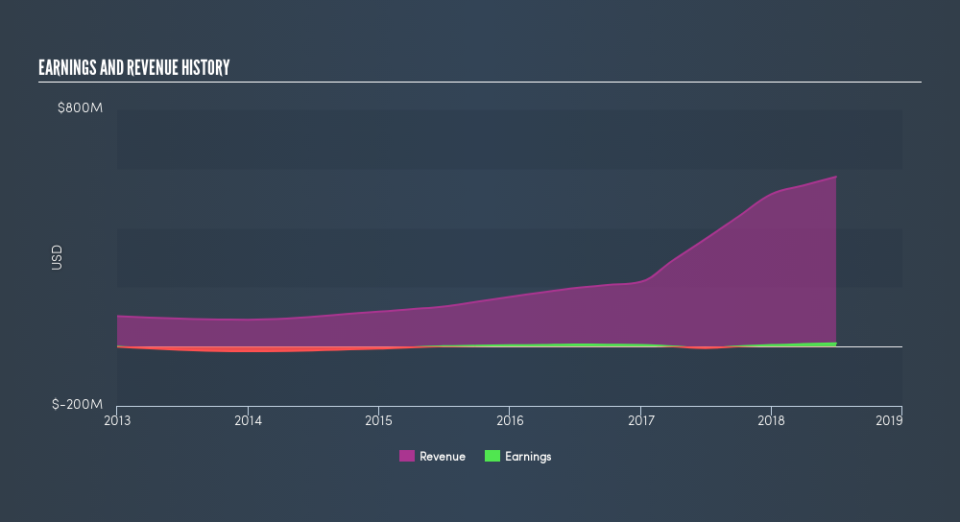
We can see that SpeedCast International does have institutional investors; and they hold 80% of the stock. This suggests some credibility amongst professional investors. But we can’t rely on that fact alone, since institutions make bad investments sometimes, just like everyone does. If multiple institutions change their view on a stock at the same time, you could see the share price drop fast. It’s therefore worth looking at SpeedCast International’s earnings history, below. Of course, the future is what really matters.
Since institutional investors own more than half the issued stock, the board will likely have to pay attention to their preferences. We note that hedge funds don’t have a meaningful investment in SpeedCast International. There are a reasonable number of analysts covering the stock, so it might be useful to find out their aggregate view on the future.
Insider Ownership Of SpeedCast International
While the precise definition of an insider can be subjective, almost everyone considers board members to be insiders. Company management run the business, but the CEO will answer to the board, even if he or she is a member of it.
Most consider insider ownership a positive because it can indicate the board is well aligned with other shareholders. However, on some occasions too much power is concentrated within this group.
I can report that insiders do own shares in SpeedCast International Limited. In their own names, insiders own AU$47m worth of stock in the AU$797m company. It is good to see some investment by insiders, but it might be worth checking if those insiders have been buying.
General Public Ownership
With a 11% ownership, the general public have some degree of sway over SDA. This size of ownership, while considerable, may not be enough to change company policy if the decision is not in sync with other large shareholders.
Private Company Ownership
We can see that Private Companies own 3.5%, of the shares on issue. It might be worth looking deeper into this. If related parties, such as insiders, have an interest in one of these private companies, that should be disclosed in the annual report. Private companies may also have a strategic interest in the company.
Next Steps:
I find it very interesting to look at who exactly owns a company. But to truly gain insight, we need to consider other information, too.
Many find it useful to take an in depth look at how a company has performed in the past. You can access this detailed graph of past earnings, revenue and cash flow .
If you would prefer discover what analysts are predicting in terms of future growth, do not miss this free report on analyst forecasts.
NB: Figures in this article are calculated using data from the last twelve months, which refer to the 12-month period ending on the last date of the month the financial statement is dated. This may not be consistent with full year annual report figures.
We aim to bring you long-term focused research analysis driven by fundamental data. Note that our analysis may not factor in the latest price-sensitive company announcements or qualitative material.
If you spot an error that warrants correction, please contact the editor at editorial-team@simplywallst.com. This article by Simply Wall St is general in nature. It does not constitute a recommendation to buy or sell any stock, and does not take account of your objectives, or your financial situation. Simply Wall St has no position in the stocks mentioned. Thank you for reading.
