Could This Star Performer Be a Value Trap?
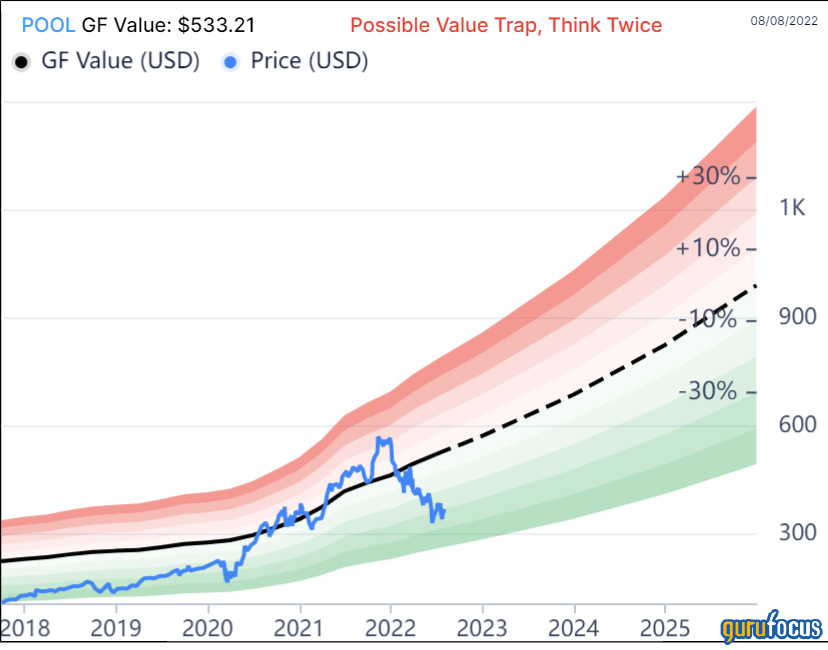
Pool Corp. (NASDAQ:POOL) has been a capital gains star over the past decade and more. But in the past six months, the share price has gone downhill. In fact, it has declined so much that the GF Value chart warns of a possible value trap.
However, is the stock really a value trap when its fundamentals are so strong? Let's take a closer look at Pool Corp. to determine whethre it is a value opportunity or a value trap.
What is a value trap?
To borrow a phrase from an unknown source, "a value trap is a stock that has fallen and may not get up." It looks like a bargain to some investors, but the price is down because of serious financial or operational trouble.
According to the GF Value description, "Possible Value Trap, Think Twice" is for the companies that look very undervalued, but are either in a long-term trend of business decline or are in financial distress.
GF Value is determined by the following criteria:
Historical valuation ratios such as the price-earnings ratio, price-sales ratio and price-book ratio.
A GuruFocus adjustment factor based on historic returns and growth.
Morningstar estimates of future business performance.
About Pool Corp
As the name suggests, Pool Corp. is a major distributor of swimming pool-related products. It offers some 200,000 items sold by more than 2,000 sales outlets and customer service reps. Last year, it sold $5.3 billion worth of products in 12 countries:
Its prospects for this year at least look promising. In the investor presentation for its latest earnings results, it guided for significant growth on both the top and bottom lines, estimating revenue growth of 17% to 19% and earnigns per share growth of 20% to 25%.
It also noted that strong demand is continuing, high construction backlogs for pools are ongoing, supplier cost changes are providing gross margin benefits and supply chain constraints are beginning to abate.
Competition
In its 10-K for 2021, Pool Corp. reported that, although it is the largest wholesale distributor of swimming pool and related backyard products, it faces intense competition. That comes from local and regional distributors and one national wholesaler of landscape supplies. In addition, there is competition from mass market retailers and large pool supply retailers.
Despite the competition, Pool Corp. is confident it has the competitive advantages it needs to stay successful, including:
Market reach through its sales center networks.
Time-saving and one-stop shopping because of its broad product selection.
Better customer service through enabling technologies.
Global reach and scale through sourcing and supply chain management.
Capacity for growth thanks to capital strength.
Disciplined execution and a focus on return on investment because of its performance-based culture.
Performance
Because the company feels it does not have a peer group, it compares itself with the S&P 500 and Nasdaq indexes in its 10-K:

Below are the annualized returns:
One year: -23.85%
Three years: 24.30%
Five years: 27.41%
10 years: 25.75%.
Financial strength
GuruFocus gives the company a middling rank for financial strength, but Pool Corp. does have lots of operating income to pay its interest, even if cash on hand is lacking.
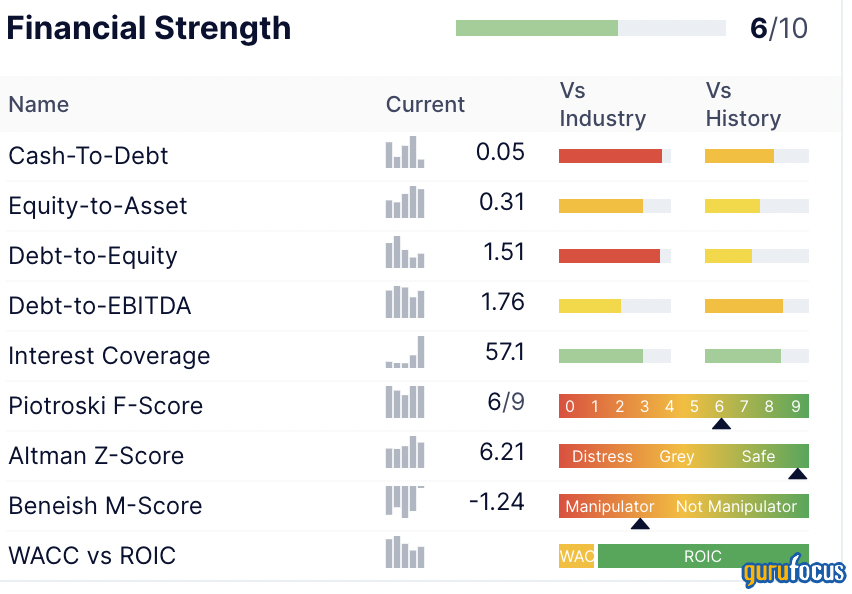
The Piotroski F-Score and Altman Z-Score give us additional insight into financial stability. At 6.21, the Altman Z-Score indicates there is not any significant risk of insolvency, while the Piotroski F-Score of 6 out of 9 indicates a healthy balance sheet.
More positive data comes from the last line on the table, with return on invested capital (ROIC) many times higher than the weighted average cost of capital (WACC), indicating value creation.
Reviewing the financial strength section leads me to believe the company is financially strong and secure.
Profitability
Pool Corp. gets an excellent GuruFocus score for profitability.
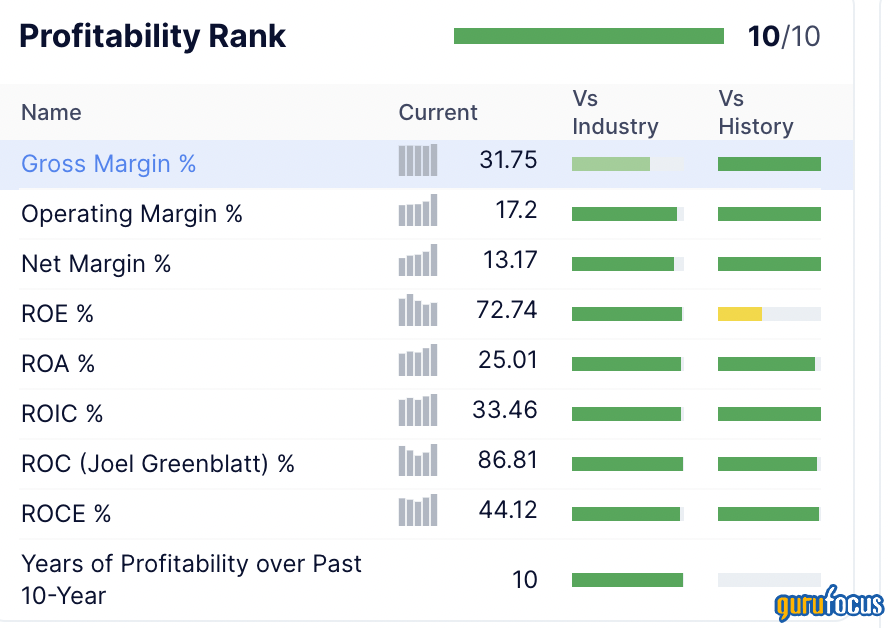
All those dark green bars on this chart tell us Pool Corp. has many industry-leading metrics. Its net margin is better than 90.73% of the 151 companies in the industrial distribution industry. Its return on equity outpaces 97.97%. It has been profitable in every one of the past 10 years.
Theres nothing in the profitability section to make me doubt Pool Corp.'s viability - quite the opposite in fact.
Growth
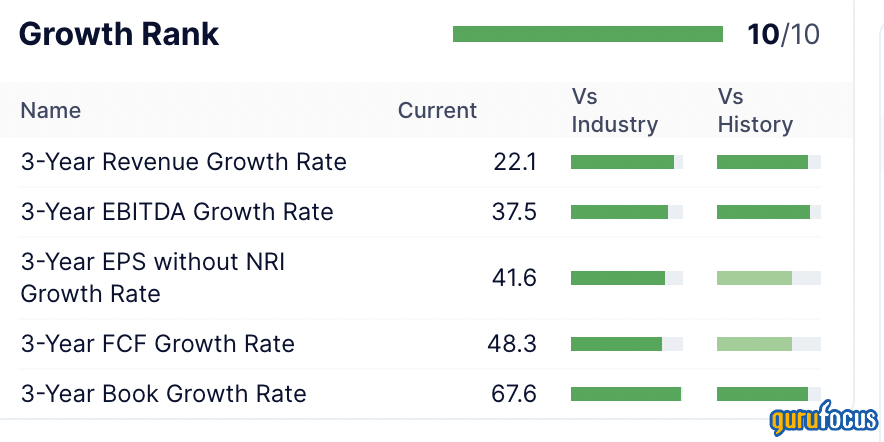
Again, Pool Corp. is a top-ranked company in its growth ranking with industry-leading revenue, Ebitda and earnings per share growth. Note too that earnigns per share growth over the past three years has been nearly double revenue growth over the same period.
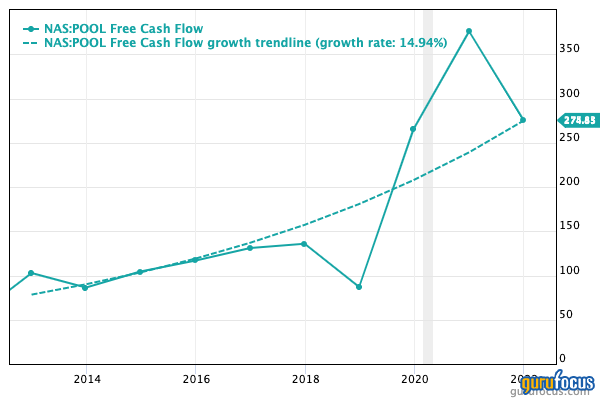
While free cash flow reversed last year, it has still delivered average growth of 14.94% per year over the past decade:
Dividends
Strong, mature companies keep raising their dividends, which is what Pool Corp. has done:
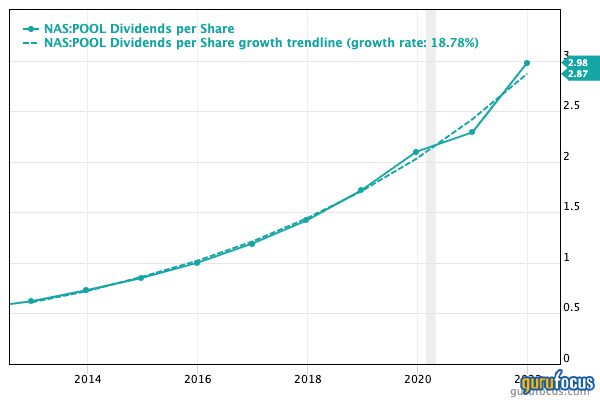
The latest dividend, $1.00 per share, was declared on July 28 and will be paid on Aug. 25.
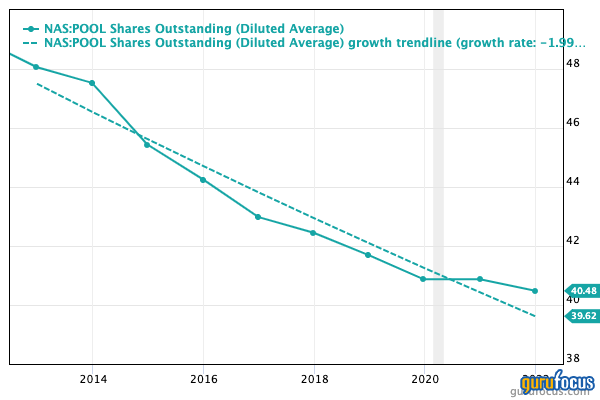
In another show of confidence, the company continues to repurchase shares, increasing the value of each remaining share:
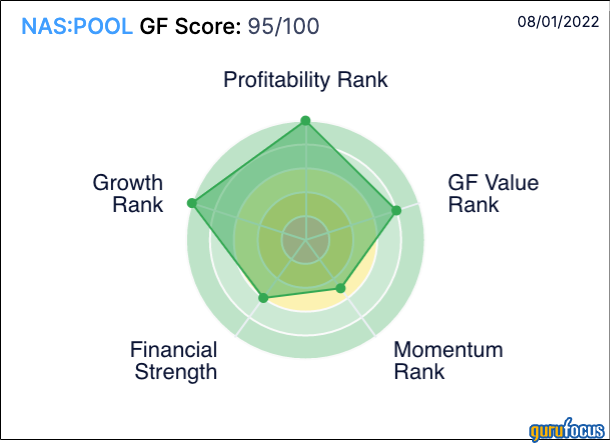
GF Score
Based on the exceptionally high scores detailed above, Pool Corp. receives a 95 out of 100 for its GF Score.
Gurus
Nine gurus owned shares in Pool Corp. at the end of the first quarter. The three largest were:
Ken Fisher (Trades, Portfolio) of Fisher Asset Management with 252,666 shares, a reduction of 2.31% since the previous quarter. The shares represent a 0.63% share of Pool Corp.s outstanding shares and 0.06% of Fishers assets under management.
Jerome Dodson (Trades, Portfolio) of the Parnassus Fund held 89,405 shares, representing 4.53% of assets under management.
Chuck Royce (Trades, Portfolio) of Royce Investment Partners owned 52,397 shares.
Institutional investors, the folks who manage pension and mutual funds, own 92.79% of the available shares of Pool Corp., while insiders own another 2.29%. The biggest insider holding is that of President and CEO Peter Arvan with 61,825 shares.
Conclusion
The fundamentals tell a very different story than the GF Value chart when it comes to Pool Corp. I believe all the signs are telling us that Pool Corp. continues to be a performance star.
While the stock price has tumbled and a few fundamental metrics may be down, I am confident the company is well placed to keep rewarding shareholders over the next five to 10 years.
This article first appeared on GuruFocus.
