Could The Torchlight Energy Resources, Inc. (NASDAQ:TRCH) Ownership Structure Tell Us Something Useful?

If you want to know who really controls Torchlight Energy Resources, Inc. (NASDAQ:TRCH), then you'll have to look at the makeup of its share registry. Insiders often own a large chunk of younger, smaller, companies while huge companies tend to have institutions as shareholders. Warren Buffett said that he likes 'a business with enduring competitive advantages that is run by able and owner-oriented people'. So it's nice to see some insider ownership, because it may suggest that management is owner-oriented.
Torchlight Energy Resources is a smaller company with a market capitalization of US$86m, so it may still be flying under the radar of many institutional investors. In the chart below below, we can see that institutions own shares in the company. We can zoom in on the different ownership groups, to learn more about TRCH.
Check out our latest analysis for Torchlight Energy Resources

What Does The Institutional Ownership Tell Us About Torchlight Energy Resources?
Many institutions measure their performance against an index that approximates the local market. So they usually pay more attention to companies that are included in major indices.
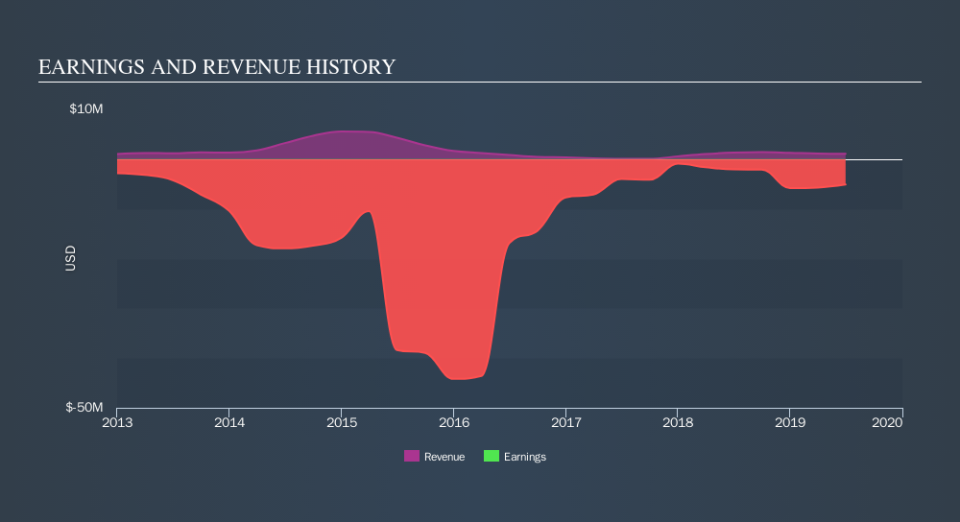
Torchlight Energy Resources already has institutions on the share registry. Indeed, they own 12% of the company. This suggests some credibility amongst professional investors. But we can't rely on that fact alone, since institutions make bad investments sometimes, just like everyone does. It is not uncommon to see a big share price drop if two large institutional investors try to sell out of a stock at the same time. So it is worth checking the past earnings trajectory of Torchlight Energy Resources, (below). Of course, keep in mind that there are other factors to consider, too.
Hedge funds don't have many shares in Torchlight Energy Resources. There is some analyst coverage of the stock, but it could still become more well known, with time.
Insider Ownership Of Torchlight Energy Resources
The definition of company insiders can be subjective, and does vary between jurisdictions. Our data reflects individual insiders, capturing board members at the very least. Company management run the business, but the CEO will answer to the board, even if he or she is a member of it.
Insider ownership is positive when it signals leadership are thinking like the true owners of the company. However, high insider ownership can also give immense power to a small group within the company. This can be negative in some circumstances.
Our information suggests that insiders maintain a significant holding in Torchlight Energy Resources, Inc.. Insiders own US$21m worth of shares in the US$86m company. I would say this shows alignment with shareholders, but it is worth noting that the company is still quite small; some insiders may have founded the business. You can click here to see if those insiders have been buying or selling.
General Public Ownership
The general public, who are mostly retail investors, collectively hold 60% of Torchlight Energy Resources shares. With this size of ownership, retail investors can collectively play a role in decisions that affect shareholder returns, such as dividend policies and the appointment of directors. They can also exercise the power to decline an acquisition or merger that may not improve profitability.
Private Company Ownership
Our data indicates that Private Companies hold 4.2%, of the company's shares. It's hard to draw any conclusions from this fact alone, so its worth looking into who owns those private companies. Sometimes insiders or other related parties have an interest in shares in a public company through a separate private company.
Next Steps:
I find it very interesting to look at who exactly owns a company. But to truly gain insight, we need to consider other information, too.
I like to dive deeper into how a company has performed in the past. You can find historic revenue and earnings in this detailed graph.
If you would prefer discover what analysts are predicting in terms of future growth, do not miss this free report on analyst forecasts.
NB: Figures in this article are calculated using data from the last twelve months, which refer to the 12-month period ending on the last date of the month the financial statement is dated. This may not be consistent with full year annual report figures.
We aim to bring you long-term focused research analysis driven by fundamental data. Note that our analysis may not factor in the latest price-sensitive company announcements or qualitative material.
If you spot an error that warrants correction, please contact the editor at editorial-team@simplywallst.com. This article by Simply Wall St is general in nature. It does not constitute a recommendation to buy or sell any stock, and does not take account of your objectives, or your financial situation. Simply Wall St has no position in the stocks mentioned. Thank you for reading.
