Will Covenant Transportation Group Inc (CVTI) Continue To Underperform Its Industry?

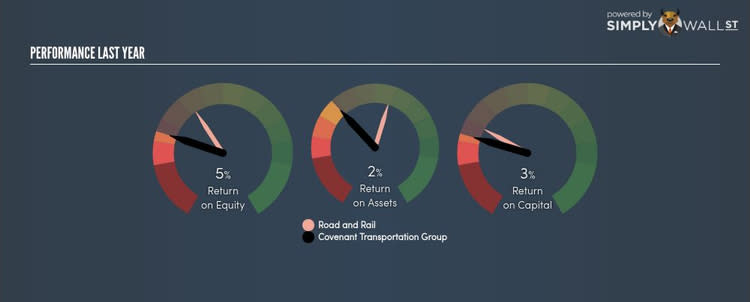
Covenant Transportation Group Inc’s (NASDAQ:CVTI) most recent return on equity was a substandard 4.53% relative to its industry performance of 10.70% over the past year. An investor may attribute an inferior ROE to a relatively inefficient performance, and whilst this can often be the case, knowing the nuts and bolts of the ROE calculation may change that perspective and give you a deeper insight into CVTI's past performance. I will take you through how metrics such as financial leverage impact ROE which may affect the overall sustainability of CVTI's returns. See our latest analysis for CVTI
Peeling the layers of ROE – trisecting a company’s profitability
Return on Equity (ROE) is a measure of CVTI’s profit relative to its shareholders’ equity. An ROE of 4.53% implies $0.05 returned on every $1 invested. In most cases, a higher ROE is preferred; however, there are many other factors we must consider prior to making any investment decisions.
Return on Equity = Net Profit ÷ Shareholders Equity
ROE is assessed against cost of equity, which is measured using the Capital Asset Pricing Model (CAPM) – but let’s not dive into the details of that today. For now, let’s just look at the cost of equity number for CVTI, which is 11.51%. Since CVTI’s return does not cover its cost, with a difference of -6.98%, this means its current use of equity is not efficient and not sustainable. Very simply, CVTI pays more for its capital than what it generates in return. ROE can be split up into three useful ratios: net profit margin, asset turnover, and financial leverage. This is called the Dupont Formula:
Dupont Formula
ROE = profit margin × asset turnover × financial leverage
ROE = (annual net profit ÷ sales) × (sales ÷ assets) × (assets ÷ shareholders’ equity)
ROE = annual net profit ÷ shareholders’ equity
Essentially, profit margin shows how much money the company makes after paying for all its expenses. Asset turnover reveals how much revenue can be generated from CVTI’s asset base. Finally, financial leverage will be our main focus today. It shows how much of assets are funded by equity and can show how sustainable CVTI’s capital structure is. Since ROE can be inflated by excessive debt, we need to examine CVTI’s debt-to-equity level. At 87.44%, CVTI’s debt-to-equity ratio appears sensible and indicates its ROE is generated from its capacity to increase profit without a large debt burden.

What this means for you:
Are you a shareholder? CVTI’s ROE is underwhelming relative to the industry average, and its returns were also not strong enough to cover its own cost of equity. However, investors shouldn’t despair since ROE is not inflated by excessive debt, which means CVTI still has room to improve shareholder returns by raising debt to fund new investments. If you're looking for new ideas for high-returning stocks, you should take a look at our free platform to see the list of stocks with Return on Equity over 20%.
Are you a potential investor? If you are considering investing in CVTI, basing your decision on ROE alone is certainly not sufficient. I recommend you do additional fundamental analysis by looking through our most recent infographic report on Covenant Transportation Group to help you make a more informed investment decision.
To help readers see pass the short term volatility of the financial market, we aim to bring you a long-term focused research analysis purely driven by fundamental data. Note that our analysis does not factor in the latest price sensitive company announcements.
The author is an independent contributor and at the time of publication had no position in the stocks mentioned.
