Is CRA International, Inc.'s (NASDAQ:CRAI) Latest Stock Performance A Reflection Of Its Financial Health?
CRA International's (NASDAQ:CRAI) stock is up by a considerable 16% over the past three months. Since the market usually pay for a company’s long-term fundamentals, we decided to study the company’s key performance indicators to see if they could be influencing the market. Specifically, we decided to study CRA International's ROE in this article.
Return on equity or ROE is an important factor to be considered by a shareholder because it tells them how effectively their capital is being reinvested. Simply put, it is used to assess the profitability of a company in relation to its equity capital.
Check out our latest analysis for CRA International
How Is ROE Calculated?
The formula for return on equity is:
Return on Equity = Net Profit (from continuing operations) ÷ Shareholders' Equity
So, based on the above formula, the ROE for CRA International is:
14% = US$29m ÷ US$211m (Based on the trailing twelve months to April 2021).
The 'return' is the income the business earned over the last year. One way to conceptualize this is that for each $1 of shareholders' capital it has, the company made $0.14 in profit.
What Has ROE Got To Do With Earnings Growth?
We have already established that ROE serves as an efficient profit-generating gauge for a company's future earnings. Based on how much of its profits the company chooses to reinvest or "retain", we are then able to evaluate a company's future ability to generate profits. Assuming all else is equal, companies that have both a higher return on equity and higher profit retention are usually the ones that have a higher growth rate when compared to companies that don't have the same features.
CRA International's Earnings Growth And 14% ROE
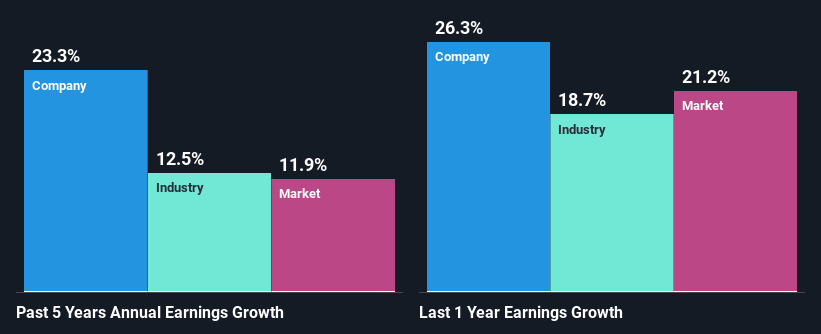
To start with, CRA International's ROE looks acceptable. Even when compared to the industry average of 14% the company's ROE looks quite decent. Consequently, this likely laid the ground for the impressive net income growth of 23% seen over the past five years by CRA International. However, there could also be other drivers behind this growth. For example, it is possible that the company's management has made some good strategic decisions, or that the company has a low payout ratio.
Next, on comparing with the industry net income growth, we found that CRA International's growth is quite high when compared to the industry average growth of 13% in the same period, which is great to see.
The basis for attaching value to a company is, to a great extent, tied to its earnings growth. It’s important for an investor to know whether the market has priced in the company's expected earnings growth (or decline). By doing so, they will have an idea if the stock is headed into clear blue waters or if swampy waters await. What is CRAI worth today? The intrinsic value infographic in our free research report helps visualize whether CRAI is currently mispriced by the market.
Is CRA International Making Efficient Use Of Its Profits?
The three-year median payout ratio for CRA International is 30%, which is moderately low. The company is retaining the remaining 70%. This suggests that its dividend is well covered, and given the high growth we discussed above, it looks like CRA International is reinvesting its earnings efficiently.
Additionally, CRA International has paid dividends over a period of five years which means that the company is pretty serious about sharing its profits with shareholders.
Conclusion
Overall, we are quite pleased with CRA International's performance. In particular, it's great to see that the company is investing heavily into its business and along with a high rate of return, that has resulted in a sizeable growth in its earnings. That being so, a study of the latest analyst forecasts show that the company is expected to see a slowdown in its future earnings growth. Are these analysts expectations based on the broad expectations for the industry, or on the company's fundamentals? Click here to be taken to our analyst's forecasts page for the company.
This article by Simply Wall St is general in nature. It does not constitute a recommendation to buy or sell any stock, and does not take account of your objectives, or your financial situation. We aim to bring you long-term focused analysis driven by fundamental data. Note that our analysis may not factor in the latest price-sensitive company announcements or qualitative material. Simply Wall St has no position in any stocks mentioned.
Have feedback on this article? Concerned about the content? Get in touch with us directly. Alternatively, email editorial-team (at) simplywallst.com.
