Crypto Traders Might Want to Track Ether 'Slippage' Indicator. Here's Why
Slippage – the difference between the price a trader expects to pay and the price they actually pay – can be used to identify changes in market trends.
Data tracked by Hyblock Capital shows spikes in slippage in the ether market frequently mark price peaks and troughs.
Traders use several technical and fundamental indicators to navigate the speedy and risky crypto market.
They can consider adding one more to the list: A gauge of "slippage" in the ether market. The indicator has consistently identified trend changes in the price of the second-largest cryptocurrency this year.
Slippage is the difference between the price at which a trading order is executed and the price at which it was requested. It occurs in fast-moving, highly volatile market conditions or when liquidity is low.
In both cases, the price moves faster than the time it takes for the order to fill either because of the volatility or the lack of supply, and can work in favor of or against traders. For instance, if a purchase order is executed at a price higher than the quoted price, it's the case of high (or unfavorable) slippage.
A spike in slippage in the ether market has historically presaged trend changes, data provided by Crypto research firm Hyblock Capital show.
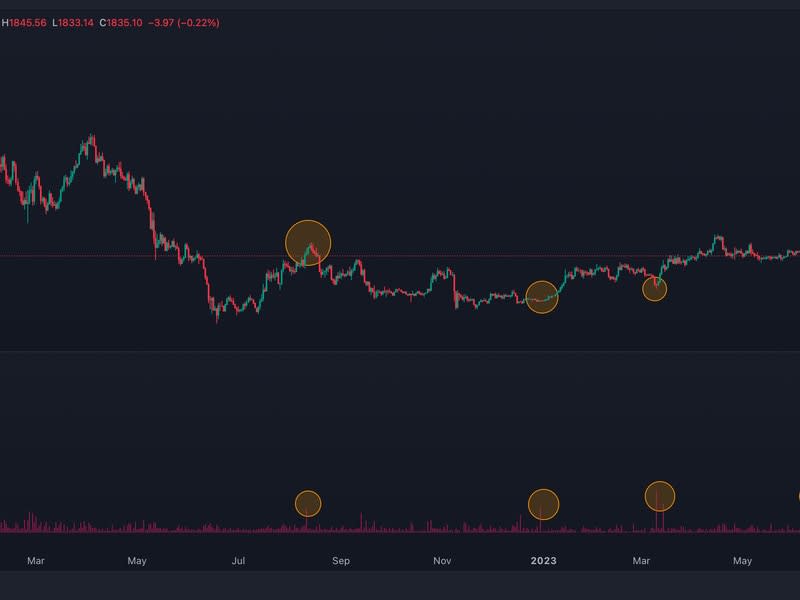
The chart shows ether's USDT-denominated price and aggregated maximum slippage – the highest daily slippage on a single market order. The aggregated max slippage includes data from crypto exchanges Binance, BitMEX, Bybit, Bitfinex, Deribit, Huobi, OKX, Phemex, and quarterly futures listed on Huobi and OKX.
Ether's late 2021 bull market peak and the December 2022 bear market bottom coincided with a sudden and notable increase in slippage. Similar spikes in slippage have marked interim tops and bottoms this year.
