What Is The Current Account Report?

Macroeconomic indicators give the public an idea about the health of the economy and are therefore closely watched by market participants. Depending on the importance and the market-moving ability of the data, they are classified into first-tier and second-tier economic data.
The ones that qualify as first-tier data include GDP, inflation and central bank decisions. There are others, though not market moving, which have implication for the economy's health. One such data point is current account data.
Breakdown
Data: Current Account
Released by: Bureau of Economic Analysis
Frequency of Release: Quarterly
Unit of Measurement: Dollars or a percentage of GDP
The OECD defines current account of a nation as a record of its international transactions with the rest of the world. It includes all transactions involving economic values and occurring between resident and non-resident entities.
Current Account Data Components
Trade In Goods: Change in ownership of a tangible or visible good from a resident to a non-resident or vice-versa.
Trade In Services: When the exchange concerns intangible things such as services, it is called traded in services.
Investment Income: This refers to the income going in or out of a country, primarily in the form of salaries, dividends on portfolio investments, direct investments, etc.
Current Transfers: These are one-way transfers such as donations, grants, aids, official assistances, pensions, etc.
Trade in goods and services account for the bulk of the current account data, with the investment income and current transfers making up only a fraction of the data. Current account is a part of another broader economic data point called the balance of payment, which comprises current account, capital account and financial account.
Calculation Of Current Account Balance
The current account balance helps us to determine whether the current account is in surplus or in deficit. It is calculated by adding the difference between the exports of goods and services with net investment income and net current transfers.
Current Account Balance Of The U.S.
The most recent quarterly numbers released by the BEA showed that the U.S. current account deficit increased to $116.8 billion in the first quarter from a revised reading of $114 billion for the fourth quarter of 2016.
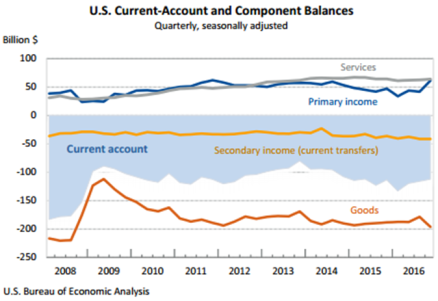
Source: BEA
As a percentage of current dollar GDP, the current account deficit rose to 2.5 percent from 2.4 percent in the preceding quarter. The recent number, however, is better than the record high deficit of 6.3 percent of GDP in the fourth quarter of 2005. The improvement has come about due to increasing domestic oil production as well as lower global oil prices that have trimmed the import bill.
Implications Of The Data
If a country runs up a huge current account deficit on an ongoing basis, it has no recourse but to finance the shortfall by increasing in the inflows into the financial account, which are essentially borrowings. Inability to service this debt or repay could lead to insolvency if the current account deficit becomes unsustainable.
The Asian financial crisis of 1997 was masterminded by countries in the region running up huge current account deficits and relying on capital funds to finance the deficit. Once confidence among investors fell, capital flows stopped, engendering the crisis.
If foreign financing becomes unavailable, the country might be handicapped to the point of even the economy grinding to a halt.
On the contrary, a surplus isn't always good either. Surplus has the potential to boost the value of a nation's currency. This in turn will reduce the competitiveness of a nation's exports, leading to a decline in exports in the long run.
As with all economic concepts, a middle-of-the-road scenario could be the best bet for an economy.
Related Links:
11 Key Economic Events In Q2 Investors Should Pay Attention To
A Decade Of GDP Slowdown: Will Trump Turn It Around?
See more from Benzinga
© 2017 Benzinga.com. Benzinga does not provide investment advice. All rights reserved.
