Is DaVita (DVA) Too Good to Be True? A Comprehensive Analysis of a Potential Value Trap
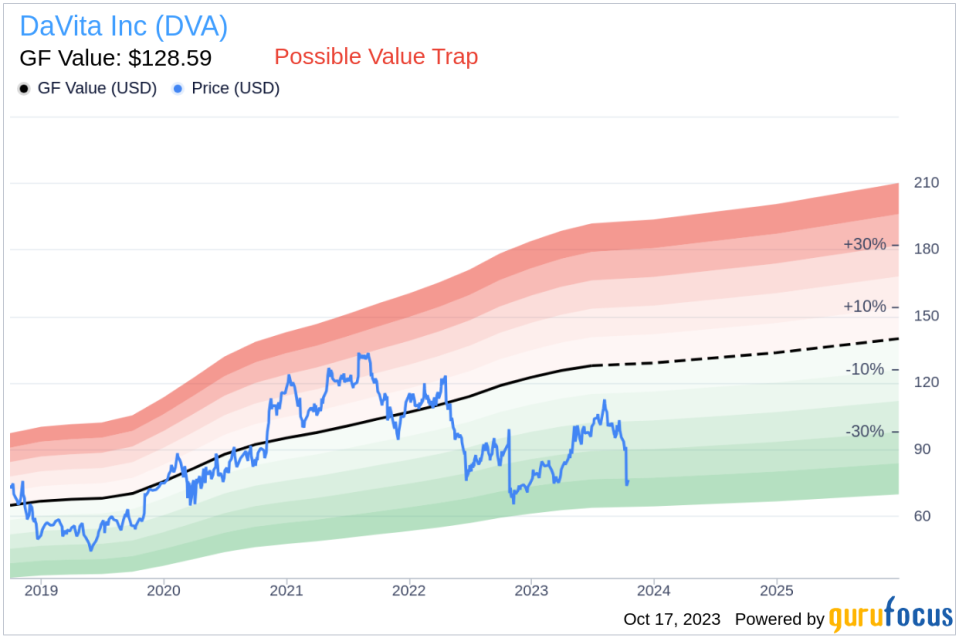
Value-focused investors are always on the hunt for stocks that are priced below their intrinsic value. One such stock that merits attention is DaVita Inc (NYSE:DVA). The stock, which is currently priced at 76.58, recorded a gain of 2.7% in a day and a 3-month decrease of 28.12%. The stock's fair valuation is $128.59, as indicated by its GF Value.
Understanding GF Value
The GF Value represents the current intrinsic value of a stock derived from our exclusive method. The GF Value Line on our summary page gives an overview of the fair value that the stock should be traded at. It is calculated based on historical multiples (PE Ratio, PS Ratio, PB Ratio and Price-to-Free-Cash-Flow) that the stock has traded at, GuruFocus adjustment factor based on the company's past returns and growth, and future estimates of the business performance.
DaVita's Potential Risks
However, investors need to consider a more in-depth analysis before making an investment decision. Despite its seemingly attractive valuation, certain risk factors associated with DaVita should not be ignored. These risks are primarily reflected through its low Altman Z-score of 1.31. These indicators suggest that DaVita, despite its apparent undervaluation, might be a potential value trap. This complexity underlines the importance of thorough due diligence in investment decision-making.
Understanding Altman Z-score
Before delving into the details, let's understand what the Altman Z-score entails. Invented by New York University Professor Edward I. Altman in 1968, the Z-Score is a financial model that predicts the probability of a company entering bankruptcy within a two-year time frame. The Altman Z-Score combines five different financial ratios, each weighted to create a final score. A score below 1.8 suggests a high likelihood of financial distress, while a score above 3 indicates a low risk.
Company Overview
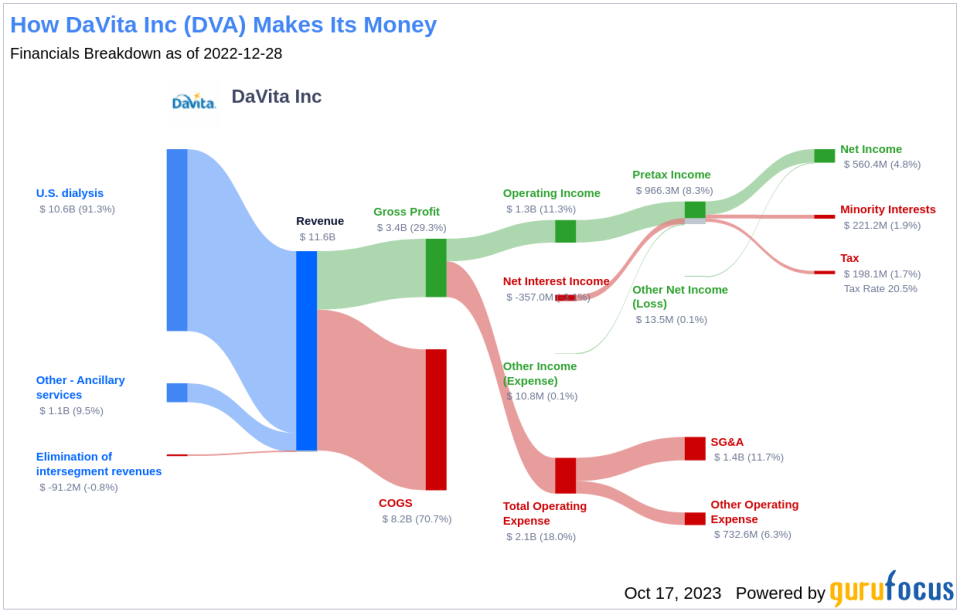
DaVita is the largest provider of dialysis services in the United States, boasting market share that eclipses 35% when measured by both patients and clinics. The firm operates over 3,000 facilities worldwide, mostly in the U.S., and treats over 240,000 patients globally each year. Government payers dominate U.S. dialysis reimbursement. DaVita receives about two thirds of U.S. sales at government (primarily Medicare) reimbursement rates, with the remainder coming from commercial insurers. However, while commercial insurers represented only about 10% of the U.S. patients treated, they represent nearly all of the profits generated by DaVita in the U.S. dialysis business.
DaVita's Low Altman Z-Score: A Breakdown of Key Drivers
A dissection of DaVita's Altman Z-score reveals DaVita's financial health may be weak, suggesting possible financial distress. The Retained Earnings to Total Assets ratio provides insights into a company's capability to reinvest its profits or manage debt. Evaluating DaVita's historical data, 2021: 0.08; 2022: 0.04; 2023: 0.03, we observe a declining trend in this ratio. This downward movement indicates DaVita's diminishing ability to reinvest in its business or effectively manage its debt. Consequently, it exerts a negative impact on its Z-Score.
Conclusion
In conclusion, despite its seemingly attractive valuation, DaVita (NYSE:DVA) might be a potential value trap based on its low Altman Z-Score and declining Retained Earnings to Total Assets ratio. This underlines the importance of comprehensive due diligence in investment decision-making. GuruFocus Premium members can find stocks with high Altman Z-Score using the following Screener: Walter Schloss Screen .
This article, generated by GuruFocus, is designed to provide general insights and is not tailored financial advice. Our commentary is rooted in historical data and analyst projections, utilizing an impartial methodology, and is not intended to serve as specific investment guidance. It does not formulate a recommendation to purchase or divest any stock and does not consider individual investment objectives or financial circumstances. Our objective is to deliver long-term, fundamental data-driven analysis. Be aware that our analysis might not incorporate the most recent, price-sensitive company announcements or qualitative information. GuruFocus holds no position in the stocks mentioned herein.
This article first appeared on GuruFocus.
