Has DCC plc (LON:DCC) Stock's Recent Performance Got Anything to Do With Its Financial Health?
DCC's (LON:DCC) stock is up by 3.7% over the past three months. Given that stock prices are usually aligned with a company's financial performance in the long-term, we decided to investigate if the company's decent financials had a hand to play in the recent price move. Specifically, we decided to study DCC's ROE in this article.
Return on Equity or ROE is a test of how effectively a company is growing its value and managing investors’ money. In other words, it is a profitability ratio which measures the rate of return on the capital provided by the company's shareholders.
View our latest analysis for DCC
How Do You Calculate Return On Equity?
The formula for return on equity is:
Return on Equity = Net Profit (from continuing operations) ÷ Shareholders' Equity
So, based on the above formula, the ROE for DCC is:
11% = UK£347m ÷ UK£3.1b (Based on the trailing twelve months to March 2023).
The 'return' is the yearly profit. Another way to think of that is that for every £1 worth of equity, the company was able to earn £0.11 in profit.
What Is The Relationship Between ROE And Earnings Growth?
We have already established that ROE serves as an efficient profit-generating gauge for a company's future earnings. Based on how much of its profits the company chooses to reinvest or "retain", we are then able to evaluate a company's future ability to generate profits. Generally speaking, other things being equal, firms with a high return on equity and profit retention, have a higher growth rate than firms that don’t share these attributes.
DCC's Earnings Growth And 11% ROE
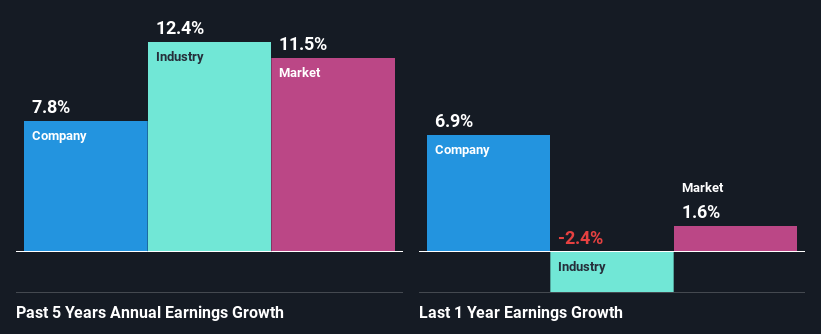
At first glance, DCC seems to have a decent ROE. Especially when compared to the industry average of 8.9% the company's ROE looks pretty impressive. This probably laid the ground for DCC's moderate 7.8% net income growth seen over the past five years.
We then compared DCC's net income growth with the industry and found that the company's growth figure is lower than the average industry growth rate of 12% in the same 5-year period, which is a bit concerning.
Earnings growth is an important metric to consider when valuing a stock. What investors need to determine next is if the expected earnings growth, or the lack of it, is already built into the share price. By doing so, they will have an idea if the stock is headed into clear blue waters or if swampy waters await. What is DCC worth today? The intrinsic value infographic in our free research report helps visualize whether DCC is currently mispriced by the market.
Is DCC Using Its Retained Earnings Effectively?
The high three-year median payout ratio of 55% (or a retention ratio of 45%) for DCC suggests that the company's growth wasn't really hampered despite it returning most of its income to its shareholders.
Moreover, DCC is determined to keep sharing its profits with shareholders which we infer from its long history of paying a dividend for at least ten years. Upon studying the latest analysts' consensus data, we found that the company's future payout ratio is expected to drop to 42% over the next three years. Despite the lower expected payout ratio, the company's ROE is not expected to change by much.
Conclusion
On the whole, we do feel that DCC has some positive attributes. Its earnings growth is decent, and the high ROE does contribute to that growth. However, investors could have benefitted even more from the high ROE, had the company been reinvesting more of its earnings. We also studied the latest analyst forecasts and found that the company's earnings growth is expected be similar to its current growth rate. Are these analysts expectations based on the broad expectations for the industry, or on the company's fundamentals? Click here to be taken to our analyst's forecasts page for the company.
Have feedback on this article? Concerned about the content? Get in touch with us directly. Alternatively, email editorial-team (at) simplywallst.com.
This article by Simply Wall St is general in nature. We provide commentary based on historical data and analyst forecasts only using an unbiased methodology and our articles are not intended to be financial advice. It does not constitute a recommendation to buy or sell any stock, and does not take account of your objectives, or your financial situation. We aim to bring you long-term focused analysis driven by fundamental data. Note that our analysis may not factor in the latest price-sensitive company announcements or qualitative material. Simply Wall St has no position in any stocks mentioned.
