Declining Stock and Decent Financials: Is The Market Wrong About Omega Flex, Inc. (NASDAQ:OFLX)?
With its stock down 4.8% over the past week, it is easy to disregard Omega Flex (NASDAQ:OFLX). But if you pay close attention, you might find that its key financial indicators look quite decent, which could mean that the stock could potentially rise in the long-term given how markets usually reward more resilient long-term fundamentals. Specifically, we decided to study Omega Flex's ROE in this article.
ROE or return on equity is a useful tool to assess how effectively a company can generate returns on the investment it received from its shareholders. In other words, it is a profitability ratio which measures the rate of return on the capital provided by the company's shareholders.
See our latest analysis for Omega Flex
How To Calculate Return On Equity?
The formula for return on equity is:
Return on Equity = Net Profit (from continuing operations) ÷ Shareholders' Equity
So, based on the above formula, the ROE for Omega Flex is:
29% = US$22m ÷ US$77m (Based on the trailing twelve months to September 2023).
The 'return' is the yearly profit. Another way to think of that is that for every $1 worth of equity, the company was able to earn $0.29 in profit.
What Is The Relationship Between ROE And Earnings Growth?
We have already established that ROE serves as an efficient profit-generating gauge for a company's future earnings. Based on how much of its profits the company chooses to reinvest or "retain", we are then able to evaluate a company's future ability to generate profits. Assuming all else is equal, companies that have both a higher return on equity and higher profit retention are usually the ones that have a higher growth rate when compared to companies that don't have the same features.
Omega Flex's Earnings Growth And 29% ROE
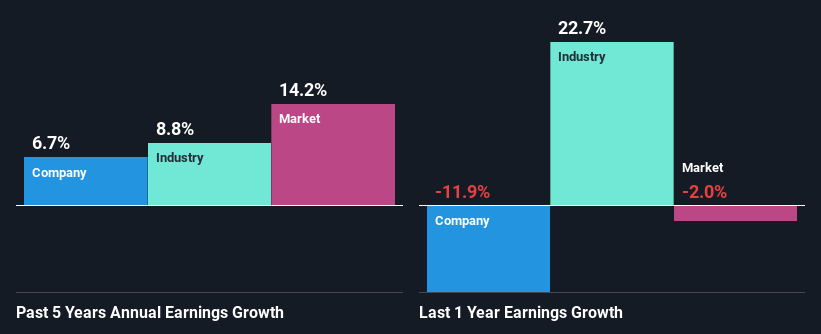
Firstly, we acknowledge that Omega Flex has a significantly high ROE. Second, a comparison with the average ROE reported by the industry of 15% also doesn't go unnoticed by us. Probably as a result of this, Omega Flex was able to see a decent net income growth of 6.7% over the last five years.
We then compared Omega Flex's net income growth with the industry and found that the company's growth figure is lower than the average industry growth rate of 8.8% in the same 5-year period, which is a bit concerning.
Earnings growth is an important metric to consider when valuing a stock. What investors need to determine next is if the expected earnings growth, or the lack of it, is already built into the share price. Doing so will help them establish if the stock's future looks promising or ominous. One good indicator of expected earnings growth is the P/E ratio which determines the price the market is willing to pay for a stock based on its earnings prospects. So, you may want to check if Omega Flex is trading on a high P/E or a low P/E, relative to its industry.
Is Omega Flex Efficiently Re-investing Its Profits?
Omega Flex has a significant three-year median payout ratio of 52%, meaning that it is left with only 48% to reinvest into its business. This implies that the company has been able to achieve decent earnings growth despite returning most of its profits to shareholders.
Besides, Omega Flex has been paying dividends for at least ten years or more. This shows that the company is committed to sharing profits with its shareholders.
Conclusion
On the whole, we do feel that Omega Flex has some positive attributes. Its earnings growth is decent, and the high ROE does contribute to that growth. However, investors could have benefitted even more from the high ROE, had the company been reinvesting more of its earnings. Until now, we have only just grazed the surface of the company's past performance by looking at the company's fundamentals. To gain further insights into Omega Flex's past profit growth, check out this visualization of past earnings, revenue and cash flows.
Have feedback on this article? Concerned about the content? Get in touch with us directly. Alternatively, email editorial-team (at) simplywallst.com.
This article by Simply Wall St is general in nature. We provide commentary based on historical data and analyst forecasts only using an unbiased methodology and our articles are not intended to be financial advice. It does not constitute a recommendation to buy or sell any stock, and does not take account of your objectives, or your financial situation. We aim to bring you long-term focused analysis driven by fundamental data. Note that our analysis may not factor in the latest price-sensitive company announcements or qualitative material. Simply Wall St has no position in any stocks mentioned.
