Decoding Coty Inc (COTY)'s Performance Potential: A Deep Dive into Key Metrics
Long-established in the Consumer Packaged Goods industry, Coty Inc (NYSE:COTY) has enjoyed a stellar reputation. However, it has recently witnessed a daily loss of 5.14%, juxtaposed with a three-month change of -11.94%. Fresh insights from the GF Score hint at potential headwinds. Notably, its diminished rankings in financial strength, growth, and valuation suggest that the company might not live up to its historical performance. Join us as we dive deep into these pivotal metrics to unravel the evolving narrative of Coty Inc.
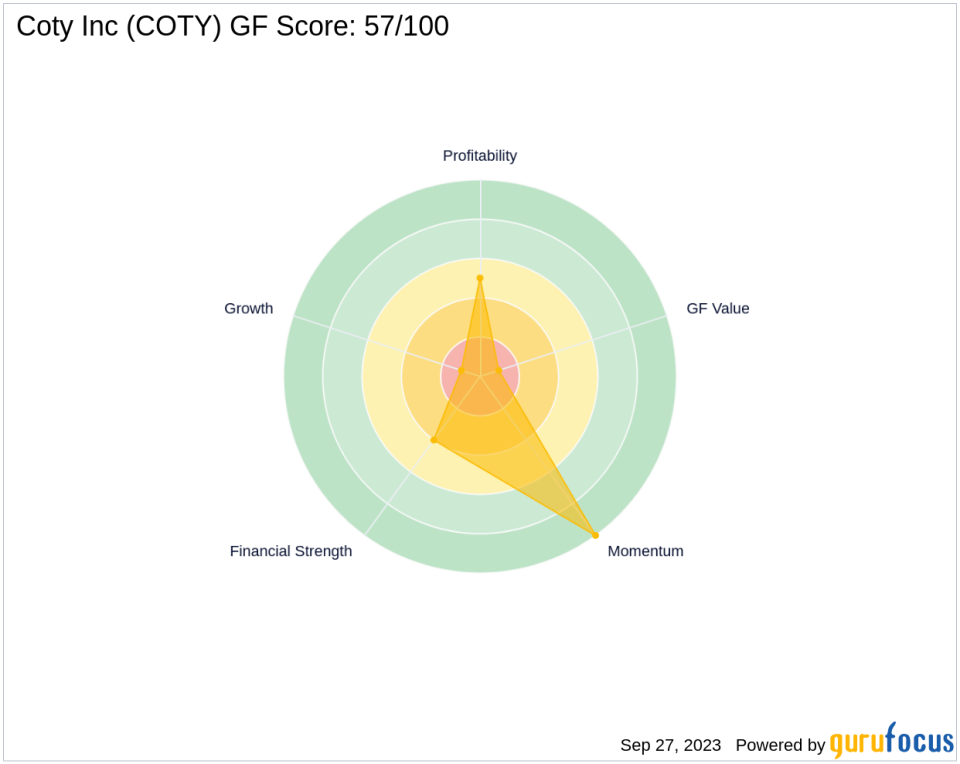
Understanding the GF Score
The GF Score is a stock performance ranking system developed by GuruFocus using five aspects of valuation, which has been found to be closely correlated to the long-term performances of stocks by backtesting from 2006 to 2021. The stocks with a higher GF Score generally generate higher returns than those with a lower GF Score. Therefore, when picking stocks, investors should invest in companies with high GF Scores. The GF Score ranges from 0 to 100, with 100 as the highest rank.
Financial strength rank: 4/10
Profitability rank: 5/10
Growth rank: 1/10
GF Value rank: 1/10
Momentum rank: 10/10
Based on the above method, GuruFocus assigned Coty Inc the GF Score of 57 out of 100, which signals poor future outperformance potential.
Snapshot of Coty Inc's Business
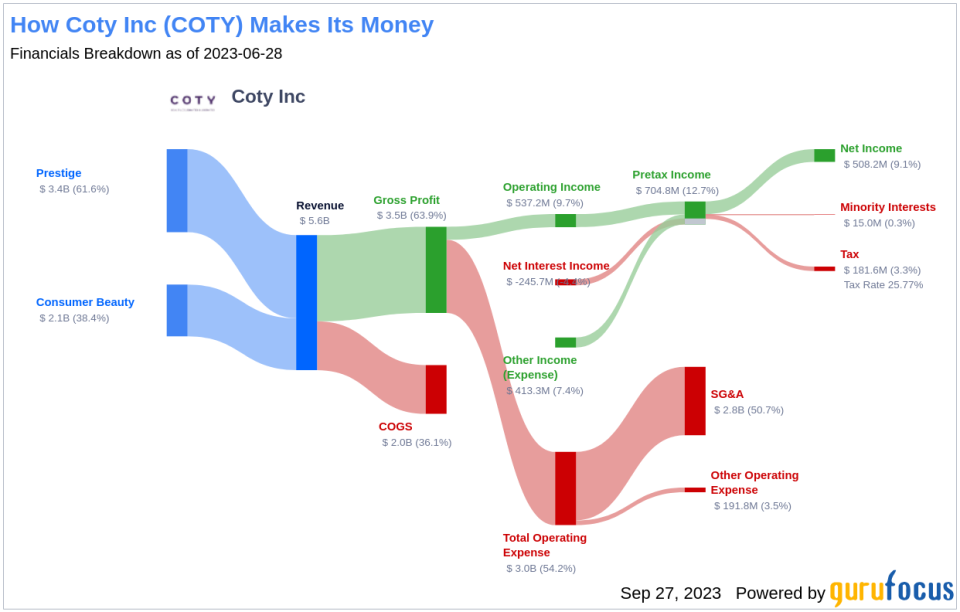
Coty Inc, with a market cap of $9.43 billion, is a global beauty firm that sells fragrance, color cosmetics, and skin and body care. It licenses brands such as Calvin Klein, Hugo Boss, Gucci, Burberry, and Davidoff for its prestige portfolio. Coty's most popular color cosmetic brands are CoverGirl, Max Factor, Rimmel, Sally Hansen, and Kylie. Coty also holds a minority stake in a salon and retail haircare business, including brands Wella, Clairol, OPI, and GHD. The company has two reportable segments such as Prestige and Consumer Beauty, generating the majority of its revenue from the Prestige segment. With sales of $5.55 billion and an operating margin of 9.67%, Coty Inc's income breakdown is as follows:
Financial Strength Analysis
Coty Inc's financial strength indicators present some concerning insights about the company's balance sheet health. Coty Inc has an interest coverage ratio of 2.06, which positions it worse than 81.58% of 1368 companies in the Consumer Packaged Goods industry. This ratio highlights potential challenges the company might face when handling its interest expenses on outstanding debt. It's worth noting that the esteemed investor Benjamin Graham typically favored companies with an interest coverage ratio of at least five.
The company's Altman Z-Scoreis just 0.79, which is below the distress zone of 1.81. This suggests that the company may face financial distress over the next few years. Additionally, the company's low cash-to-debt ratio at 0.05 indicates a struggle in handling existing debt levels.
Profitability and Growth Prospects
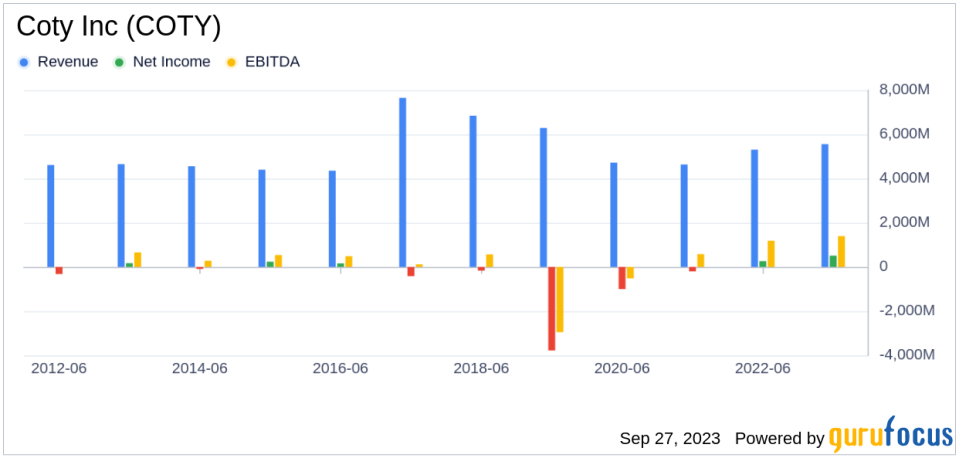
Coty Inc's low Profitability rank can also raise warning signals. A lack of significant growth is another area where Coty Inc seems to falter, as evidenced by the company's low Growth rank. Lastly, Coty Inc predictability rank is just one star out of five, adding to investor uncertainty regarding revenue and earnings consistency.
Conclusion
Given Coty Inc's financial strength, profitability, and growth metrics, the GF Score highlights the firm's unparalleled position for potential underperformance. While the company has a rich history and a diverse portfolio, its current financial indicators suggest that it may struggle to maintain its past performance. As value investors, it's crucial to consider these factors when making investment decisions.
GuruFocus Premium members can find more companies with strong GF Scores using the following screener link: GF Score Screen
This article first appeared on GuruFocus.
