Decoding Sunrun Inc (RUN)'s Performance Potential: A Deep Dive into Key Metrics
Long-established in the Semiconductors industry, Sunrun Inc (NASDAQ:RUN) has enjoyed a stellar reputation. It has recently witnessed a daily gain of 10.81%, juxtaposed with a three-month change of -35.67%. However, fresh insights from the GF Score hint at potential headwinds. Notably, its diminished rankings in financial strength, growth, and valuation suggest that the company might not live up to its historical performance. Join us as we dive deep into these pivotal metrics to unravel the evolving narrative of Sunrun Inc.
Understanding the GF Score
The GF Score is a stock performance ranking system developed by GuruFocus using five aspects of valuation, which has been found to be closely correlated to the long-term performances of stocks by backtesting from 2006 to 2021. The stocks with a higher GF Score generally generate higher returns than those with a lower GF Score. Therefore, when picking stocks, investors should invest in companies with high GF Scores. The GF Score ranges from 0 to 100, with 100 as the highest rank.
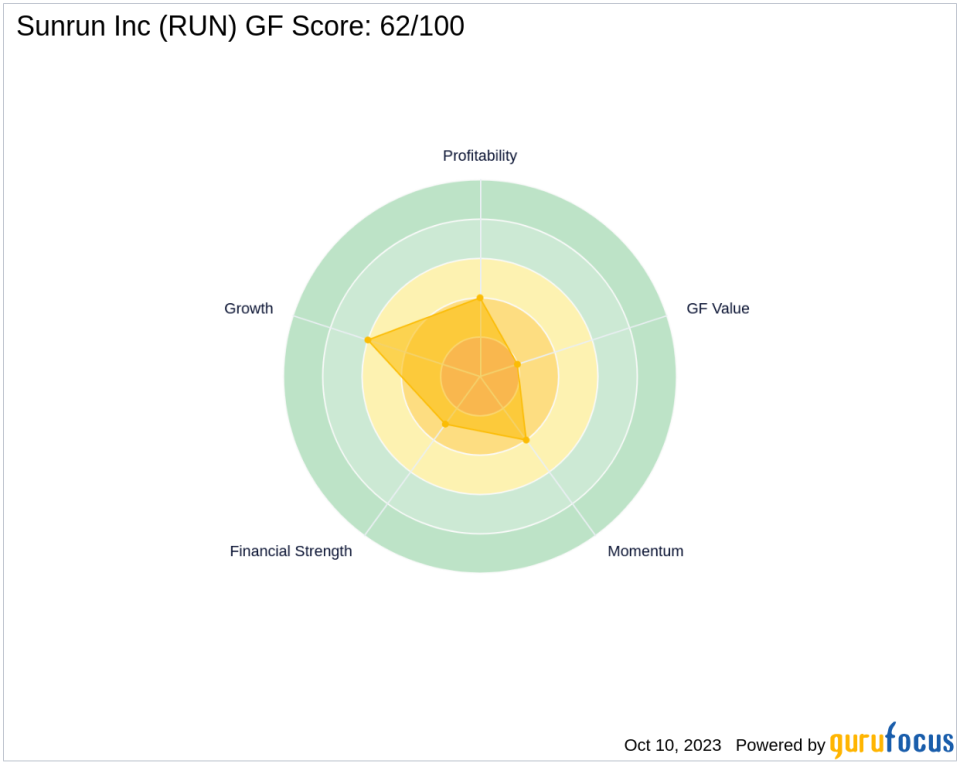
Financial strength rank: 3/10
Profitability rank: 4/10
Growth rank: 6/10
GF Value rank: 2/10
Momentum rank: 4/10
Based on the above method, GuruFocus assigned Sunrun Inc the GF Score of 62 out of 100, which signals poor future outperformance potential.
Unveiling Sunrun Inc's Business
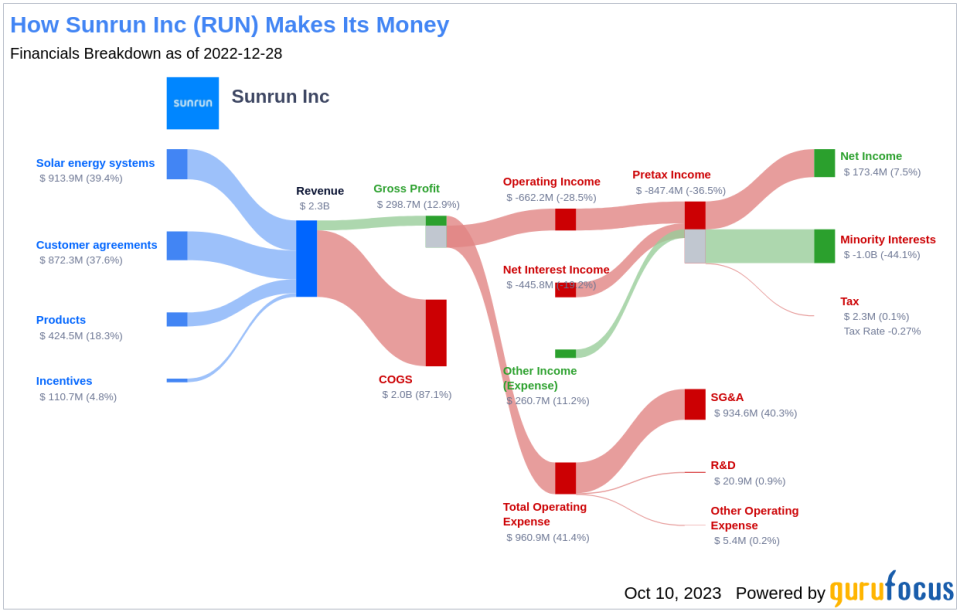
Sunrun Inc, with a market cap of $2.53 billion, is engaged in the design, development, installation, sale, ownership, and maintenance of residential solar energy systems in the United States. The company acquires customers directly and through relationships with various solar and strategic partners. The solar systems are constructed either by Sunrun or by Sunrun's partners and are owned by the company. Sunrun's customers typically enter into 20- to 25-year agreements to utilize its solar energy system. The company also sells solar energy systems and products, such as panels and racking, and solar leads generated to customers. However, with an operating margin of -31.35% and sales of $2.42 billion, the company's profitability is a concern.
Financial Strength Analysis
Sunrun Inc's financial strength indicators present some concerning insights about the company's balance sheet health. The company's interest coverage ratio of 0 positions it worse than 0% of 647 companies in the Semiconductors industry. This ratio highlights potential challenges the company might face when handling its interest expenses on outstanding debt. The company's Altman Z-Score is just 0.16, which is below the distress zone of 1.81. This suggests that the company may face financial distress over the next few years. Additionally, the company's low cash-to-debt ratio at 0.07 indicates a struggle in handling existing debt levels.
Profitability Breakdown
Sunrun Inc's low Profitability rank can also raise warning signals. The company's Operating Margin has declined over the past five years ((-124,879.00%)), as shown by the following data: 2018: -16.04; 2019: -25.13; 2020: -50.44; 2021: -41.38; 2022: -28.53. Additionally, Sunrun Inc's Gross Margin has also declined over the past five years, as evidenced by the data: 2018: 29.61; 2019: 24.78; 2020: 19.37; 2021: 15.19; 2022: 12.87. This trend underscores the company's struggles to convert its revenue into profits.
Conclusion
Given Sunrun Inc's financial strength, profitability, and growth metrics, the GF Score highlights the firm's unparalleled position for potential underperformance. While the company has a strong foothold in the Semiconductors industry, its declining profitability and financial strength metrics indicate potential challenges ahead. Therefore, investors should exercise caution and conduct thorough research before investing in Sunrun Inc.
GuruFocus Premium members can find more companies with strong GF Scores using the following screener link: GF Score Screen
This article, generated by GuruFocus, is designed to provide general insights and is not tailored financial advice. Our commentary is rooted in historical data and analyst projections, utilizing an impartial methodology, and is not intended to serve as specific investment guidance. It does not formulate a recommendation to purchase or divest any stock and does not consider individual investment objectives or financial circumstances. Our objective is to deliver long-term, fundamental data-driven analysis. Be aware that our analysis might not incorporate the most recent, price-sensitive company announcements or qualitative information. GuruFocus holds no position in the stocks mentioned herein.
This article first appeared on GuruFocus.
