How Do Deson Development International Holdings Limited’s (HKG:262) Returns On Capital Compare To Peers?

Want to participate in a short research study? Help shape the future of investing tools and you could win a $250 gift card!
Today we’ll evaluate Deson Development International Holdings Limited (HKG:262) to determine whether it could have potential as an investment idea. In particular, we’ll consider its Return On Capital Employed (ROCE), as that can give us insight into how profitably the company is able to employ capital in its business.
First up, we’ll look at what ROCE is and how we calculate it. Second, we’ll look at its ROCE compared to similar companies. Last but not least, we’ll look at what impact its current liabilities have on its ROCE.
Understanding Return On Capital Employed (ROCE)
ROCE is a metric for evaluating how much pre-tax income (in percentage terms) a company earns on the capital invested in its business. In general, businesses with a higher ROCE are usually better quality. Ultimately, it is a useful but imperfect metric. Renowned investment researcher Michael Mauboussin has suggested that a high ROCE can indicate that ‘one dollar invested in the company generates value of more than one dollar’.
So, How Do We Calculate ROCE?
Analysts use this formula to calculate return on capital employed:
Return on Capital Employed = Earnings Before Interest and Tax (EBIT) ÷ (Total Assets – Current Liabilities)
Or for Deson Development International Holdings:
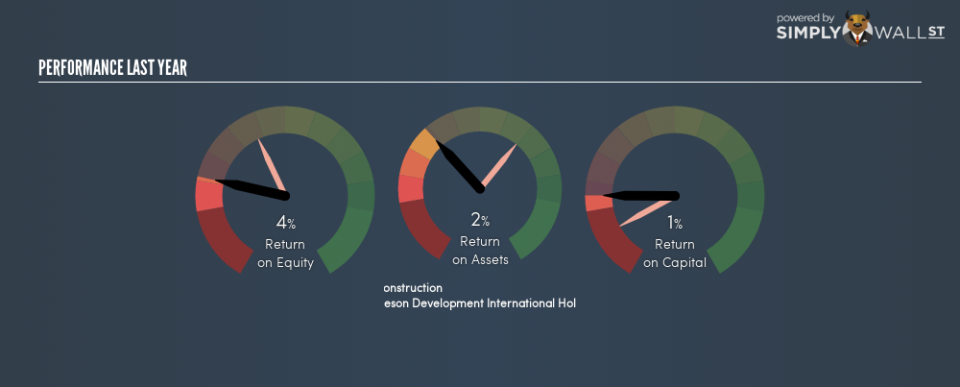
0.012 = -HK$20.4m ÷ (HK$2.5b – HK$390m) (Based on the trailing twelve months to September 2018.)
So, Deson Development International Holdings has an ROCE of 1.2%.
Check out our latest analysis for Deson Development International Holdings
Does Deson Development International Holdings Have A Good ROCE?
ROCE can be useful when making comparisons, such as between similar companies. We can see Deson Development International Holdings’s ROCE is meaningfully below the Construction industry average of 14%. This could be seen as a negative, as it suggests some competitors may be employing their capital more efficiently. Independently of how Deson Development International Holdings compares to its industry, its ROCE in absolute terms is low; especially compared to the ~2.0% available in government bonds. Readers may wish to look for more rewarding investments.
Deson Development International Holdings delivered an ROCE of 1.2%, which is better than 3 years ago, as was making losses back then. That suggests the business has returned to profitability.
Remember that this metric is backwards looking – it shows what has happened in the past, and does not accurately predict the future. ROCE can be deceptive for cyclical businesses, as returns can look incredible in boom times, and terribly low in downturns. ROCE is only a point-in-time measure. How cyclical is Deson Development International Holdings? You can see for yourself by looking at this free graph of past earnings, revenue and cash flow.
How Deson Development International Holdings’s Current Liabilities Impact Its ROCE
Liabilities, such as supplier bills and bank overdrafts, are referred to as current liabilities if they need to be paid within 12 months. The ROCE equation subtracts current liabilities from capital employed, so a company with a lot of current liabilities appears to have less capital employed, and a higher ROCE than otherwise. To counteract this, we check if a company has high current liabilities, relative to its total assets.
Deson Development International Holdings has total liabilities of HK$390m and total assets of HK$2.5b. Therefore its current liabilities are equivalent to approximately 16% of its total assets. With a very reasonable level of current liabilities, so the impact on ROCE is fairly minimal.
What We Can Learn From Deson Development International Holdings’s ROCE
Deson Development International Holdings has a poor ROCE, and there may be better investment prospects out there. Of course, you might find a fantastic investment by looking at a few good candidates. So take a peek at this free list of companies with modest (or no) debt, trading on a P/E below 20.
If you like to buy stocks alongside management, then you might just love this free list of companies. (Hint: insiders have been buying them).
To help readers see past the short term volatility of the financial market, we aim to bring you a long-term focused research analysis purely driven by fundamental data. Note that our analysis does not factor in the latest price-sensitive company announcements.
The author is an independent contributor and at the time of publication had no position in the stocks mentioned. For errors that warrant correction please contact the editor at editorial-team@simplywallst.com.
