Despite delivering investors losses of 26% over the past 3 years, Siltronic (ETR:WAF) has been growing its earnings
While it may not be enough for some shareholders, we think it is good to see the Siltronic AG (ETR:WAF) share price up 16% in a single quarter. But that cannot eclipse the less-than-impressive returns over the last three years. In fact, the share price is down 33% in the last three years, falling well short of the market return.
On a more encouraging note the company has added €78m to its market cap in just the last 7 days, so let's see if we can determine what's driven the three-year loss for shareholders.
View our latest analysis for Siltronic
There is no denying that markets are sometimes efficient, but prices do not always reflect underlying business performance. By comparing earnings per share (EPS) and share price changes over time, we can get a feel for how investor attitudes to a company have morphed over time.
During the unfortunate three years of share price decline, Siltronic actually saw its earnings per share (EPS) improve by 17% per year. Given the share price reaction, one might suspect that EPS is not a good guide to the business performance during the period (perhaps due to a one-off loss or gain). Alternatively, growth expectations may have been unreasonable in the past.
Since the change in EPS doesn't seem to correlate with the change in share price, it's worth taking a look at other metrics.
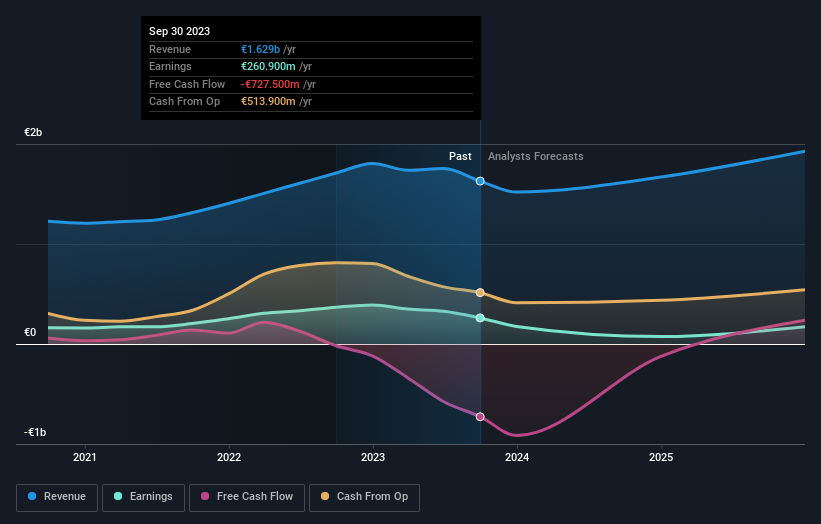
Revenue is actually up 15% over the three years, so the share price drop doesn't seem to hinge on revenue, either. This analysis is just perfunctory, but it might be worth researching Siltronic more closely, as sometimes stocks fall unfairly. This could present an opportunity.
You can see how earnings and revenue have changed over time in the image below (click on the chart to see the exact values).
Siltronic is a well known stock, with plenty of analyst coverage, suggesting some visibility into future growth. You can see what analysts are predicting for Siltronic in this interactive graph of future profit estimates.
What About Dividends?
When looking at investment returns, it is important to consider the difference between total shareholder return (TSR) and share price return. The TSR incorporates the value of any spin-offs or discounted capital raisings, along with any dividends, based on the assumption that the dividends are reinvested. Arguably, the TSR gives a more comprehensive picture of the return generated by a stock. In the case of Siltronic, it has a TSR of -26% for the last 3 years. That exceeds its share price return that we previously mentioned. This is largely a result of its dividend payments!
A Different Perspective
We're pleased to report that Siltronic shareholders have received a total shareholder return of 19% over one year. And that does include the dividend. That gain is better than the annual TSR over five years, which is 8%. Therefore it seems like sentiment around the company has been positive lately. Someone with an optimistic perspective could view the recent improvement in TSR as indicating that the business itself is getting better with time. It's always interesting to track share price performance over the longer term. But to understand Siltronic better, we need to consider many other factors. Even so, be aware that Siltronic is showing 3 warning signs in our investment analysis , and 2 of those are a bit unpleasant...
Of course, you might find a fantastic investment by looking elsewhere. So take a peek at this free list of companies we expect will grow earnings.
Please note, the market returns quoted in this article reflect the market weighted average returns of stocks that currently trade on German exchanges.
Have feedback on this article? Concerned about the content? Get in touch with us directly. Alternatively, email editorial-team (at) simplywallst.com.
This article by Simply Wall St is general in nature. We provide commentary based on historical data and analyst forecasts only using an unbiased methodology and our articles are not intended to be financial advice. It does not constitute a recommendation to buy or sell any stock, and does not take account of your objectives, or your financial situation. We aim to bring you long-term focused analysis driven by fundamental data. Note that our analysis may not factor in the latest price-sensitive company announcements or qualitative material. Simply Wall St has no position in any stocks mentioned.
