Despite Its High P/E Ratio, Is L E Lundbergföretagen AB (publ) (STO:LUND B) Still Undervalued?

This article is for investors who would like to improve their understanding of price to earnings ratios (P/E ratios). We'll show how you can use L E Lundbergföretagen AB (publ)'s (STO:LUND B) P/E ratio to inform your assessment of the investment opportunity. What is L E Lundbergföretagen's P/E ratio? Well, based on the last twelve months it is 16.11. That corresponds to an earnings yield of approximately 6.2%.
See our latest analysis for L E Lundbergföretagen
How Do I Calculate L E Lundbergföretagen's Price To Earnings Ratio?
The formula for P/E is:
Price to Earnings Ratio = Price per Share ÷ Earnings per Share (EPS)
Or for L E Lundbergföretagen:
P/E of 16.11 = SEK384.80 ÷ SEK23.88 (Based on the year to June 2019.)
Is A High Price-to-Earnings Ratio Good?
The higher the P/E ratio, the higher the price tag of a business, relative to its trailing earnings. That is not a good or a bad thing per se, but a high P/E does imply buyers are optimistic about the future.
Does L E Lundbergföretagen Have A Relatively High Or Low P/E For Its Industry?
The P/E ratio essentially measures market expectations of a company. You can see in the image below that the average P/E (15.8) for companies in the diversified financial industry is roughly the same as L E Lundbergföretagen's P/E.
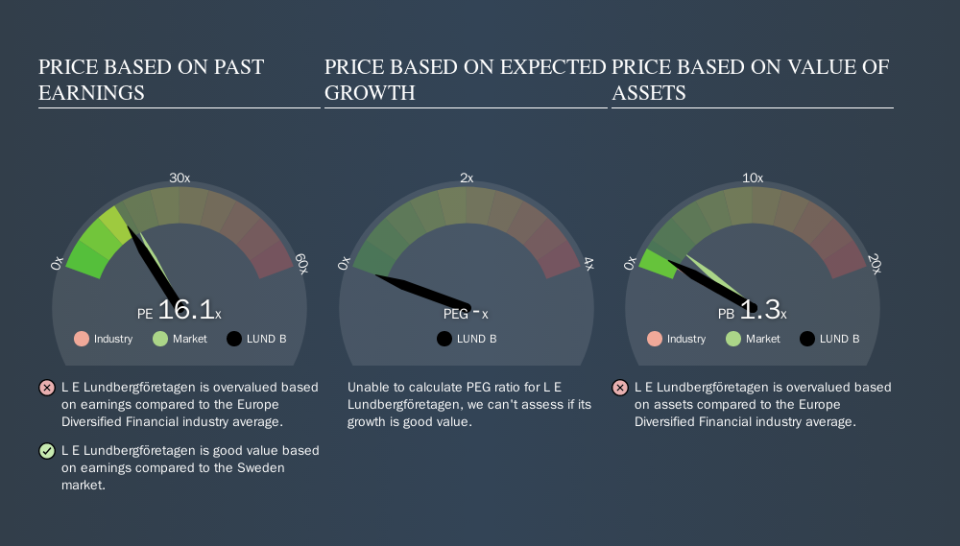
L E Lundbergföretagen's P/E tells us that market participants think its prospects are roughly in line with its industry. If the company has better than average prospects, then the market might be underestimating it. I would further inform my view by checking insider buying and selling., among other things.
How Growth Rates Impact P/E Ratios
If earnings fall then in the future the 'E' will be lower. That means unless the share price falls, the P/E will increase in a few years. A higher P/E should indicate the stock is expensive relative to others -- and that may encourage shareholders to sell.
L E Lundbergföretagen increased earnings per share by 6.0% last year. And its annual EPS growth rate over 5 years is 14%. In contrast, EPS has decreased by 14%, annually, over 3 years.
Remember: P/E Ratios Don't Consider The Balance Sheet
The 'Price' in P/E reflects the market capitalization of the company. Thus, the metric does not reflect cash or debt held by the company. The exact same company would hypothetically deserve a higher P/E ratio if it had a strong balance sheet, than if it had a weak one with lots of debt, because a cashed up company can spend on growth.
Spending on growth might be good or bad a few years later, but the point is that the P/E ratio does not account for the option (or lack thereof).
So What Does L E Lundbergföretagen's Balance Sheet Tell Us?
The extra options and safety that comes with L E Lundbergföretagen's kr1.3b net cash position means that it deserves a higher P/E than it would if it had a lot of net debt.
The Verdict On L E Lundbergföretagen's P/E Ratio
L E Lundbergföretagen has a P/E of 16.1. That's below the average in the SE market, which is 18.2. EPS was up modestly better over the last twelve months. Also positive, the relatively strong balance sheet will allow for investment in growth. In contrast, the P/E indicates shareholders doubt that will happen!
When the market is wrong about a stock, it gives savvy investors an opportunity. If it is underestimating a company, investors can make money by buying and holding the shares until the market corrects itself. Although we don't have analyst forecasts shareholders might want to examine this detailed historical graph of earnings, revenue and cash flow.
Of course, you might find a fantastic investment by looking at a few good candidates. So take a peek at this free list of companies with modest (or no) debt, trading on a P/E below 20.
We aim to bring you long-term focused research analysis driven by fundamental data. Note that our analysis may not factor in the latest price-sensitive company announcements or qualitative material.
If you spot an error that warrants correction, please contact the editor at editorial-team@simplywallst.com. This article by Simply Wall St is general in nature. It does not constitute a recommendation to buy or sell any stock, and does not take account of your objectives, or your financial situation. Simply Wall St has no position in the stocks mentioned. Thank you for reading.
