Despite recent sales, Mission Produce, Inc. (NASDAQ:AVO) insiders still hold the largest share with a 40% interest
Key Insights
Mission Produce's significant insider ownership suggests inherent interests in company's expansion
51% of the business is held by the top 7 shareholders
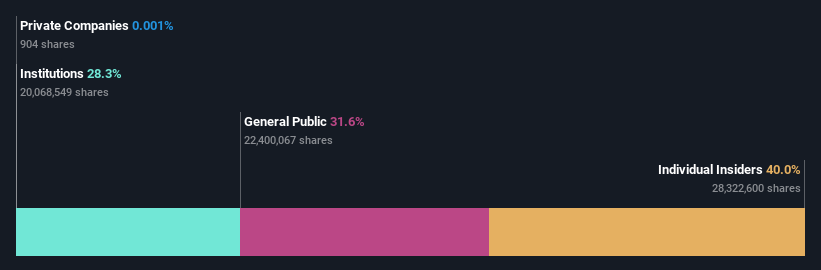
A look at the shareholders of Mission Produce, Inc. (NASDAQ:AVO) can tell us which group is most powerful. The group holding the most number of shares in the company, around 40% to be precise, is individual insiders. That is, the group stands to benefit the most if the stock rises (or lose the most if there is a downturn).
And insiders own the top position in the company’s share registry despite recent sales.
Let's take a closer look to see what the different types of shareholders can tell us about Mission Produce.
View our latest analysis for Mission Produce
What Does The Institutional Ownership Tell Us About Mission Produce?
Institutional investors commonly compare their own returns to the returns of a commonly followed index. So they generally do consider buying larger companies that are included in the relevant benchmark index.
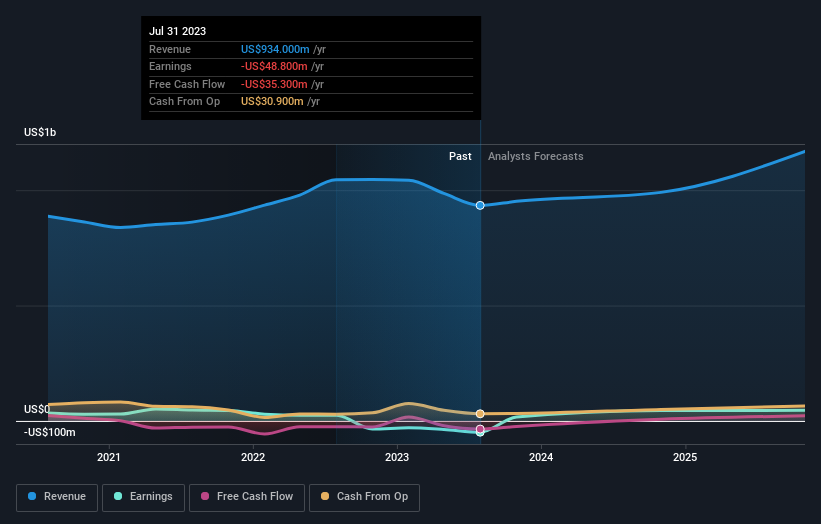
As you can see, institutional investors have a fair amount of stake in Mission Produce. This can indicate that the company has a certain degree of credibility in the investment community. However, it is best to be wary of relying on the supposed validation that comes with institutional investors. They too, get it wrong sometimes. When multiple institutions own a stock, there's always a risk that they are in a 'crowded trade'. When such a trade goes wrong, multiple parties may compete to sell stock fast. This risk is higher in a company without a history of growth. You can see Mission Produce's historic earnings and revenue below, but keep in mind there's always more to the story.
Hedge funds don't have many shares in Mission Produce. Our data shows that Bruce Taylor is the largest shareholder with 14% of shares outstanding. In comparison, the second and third largest shareholders hold about 13% and 6.2% of the stock. In addition, we found that Stephen Barnard, the CEO has 5.8% of the shares allocated to their name.
On further inspection, we found that more than half the company's shares are owned by the top 7 shareholders, suggesting that the interests of the larger shareholders are balanced out to an extent by the smaller ones.
Researching institutional ownership is a good way to gauge and filter a stock's expected performance. The same can be achieved by studying analyst sentiments. Quite a few analysts cover the stock, so you could look into forecast growth quite easily.
Insider Ownership Of Mission Produce
The definition of an insider can differ slightly between different countries, but members of the board of directors always count. Management ultimately answers to the board. However, it is not uncommon for managers to be executive board members, especially if they are a founder or the CEO.
Most consider insider ownership a positive because it can indicate the board is well aligned with other shareholders. However, on some occasions too much power is concentrated within this group.
Our information suggests that insiders maintain a significant holding in Mission Produce, Inc.. Insiders own US$271m worth of shares in the US$677m company. We would say this shows alignment with shareholders, but it is worth noting that the company is still quite small; some insiders may have founded the business. You can click here to see if those insiders have been buying or selling.
General Public Ownership
The general public, who are usually individual investors, hold a 32% stake in Mission Produce. This size of ownership, while considerable, may not be enough to change company policy if the decision is not in sync with other large shareholders.
Next Steps:
While it is well worth considering the different groups that own a company, there are other factors that are even more important.
I always like to check for a history of revenue growth. You can too, by accessing this free chart of historic revenue and earnings in this detailed graph.
If you are like me, you may want to think about whether this company will grow or shrink. Luckily, you can check this free report showing analyst forecasts for its future.
NB: Figures in this article are calculated using data from the last twelve months, which refer to the 12-month period ending on the last date of the month the financial statement is dated. This may not be consistent with full year annual report figures.
Have feedback on this article? Concerned about the content? Get in touch with us directly. Alternatively, email editorial-team (at) simplywallst.com.
This article by Simply Wall St is general in nature. We provide commentary based on historical data and analyst forecasts only using an unbiased methodology and our articles are not intended to be financial advice. It does not constitute a recommendation to buy or sell any stock, and does not take account of your objectives, or your financial situation. We aim to bring you long-term focused analysis driven by fundamental data. Note that our analysis may not factor in the latest price-sensitive company announcements or qualitative material. Simply Wall St has no position in any stocks mentioned.
